
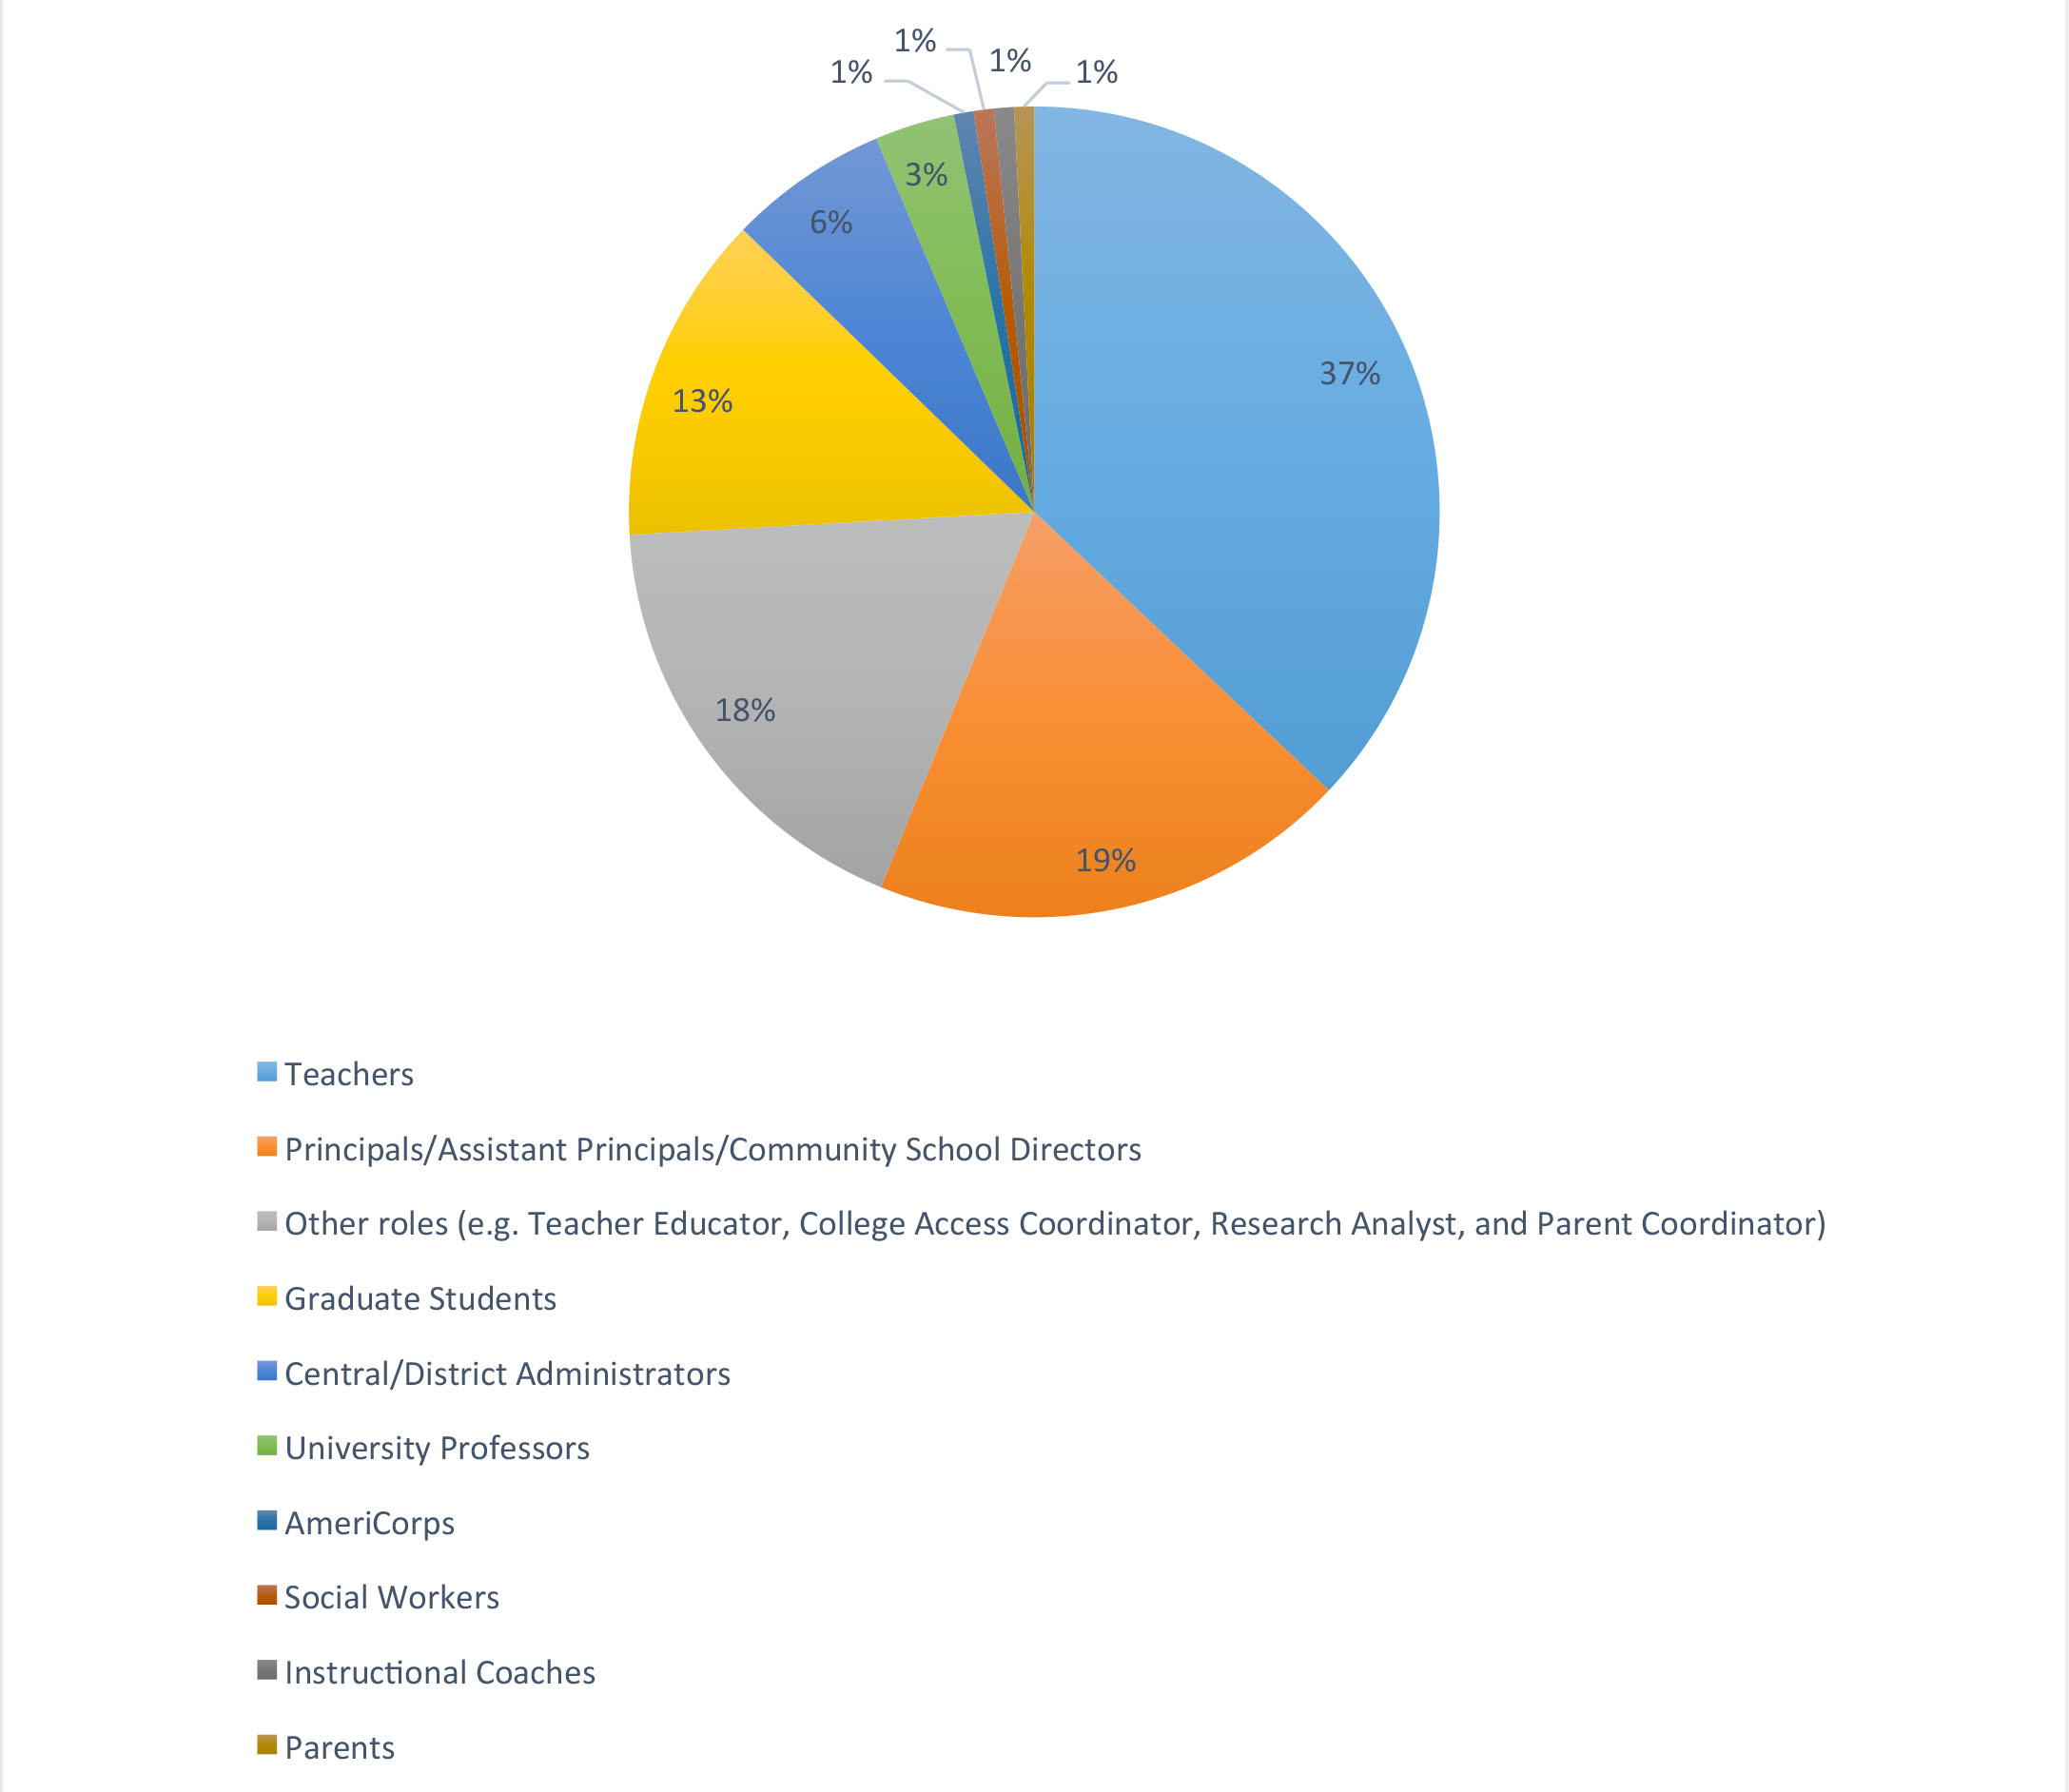
The Institute serves different people who are in various educational roles and capacities, and brings them together for dialogue. About 37 percent of attendees were teachers, and 19 percent were principals, assistant principals, or community school directors. Other attendees were graduate students, central/district administrators, university professors, social workers, instructional coaches, school counselors, CEOs, and AmeriCorps members. Out of 250 of the Institute attendees surveyed, 37.2% were teachers, 18.4% were principals/assistant principals/ community school directors (19.2%), and 13.2% were graduate students.
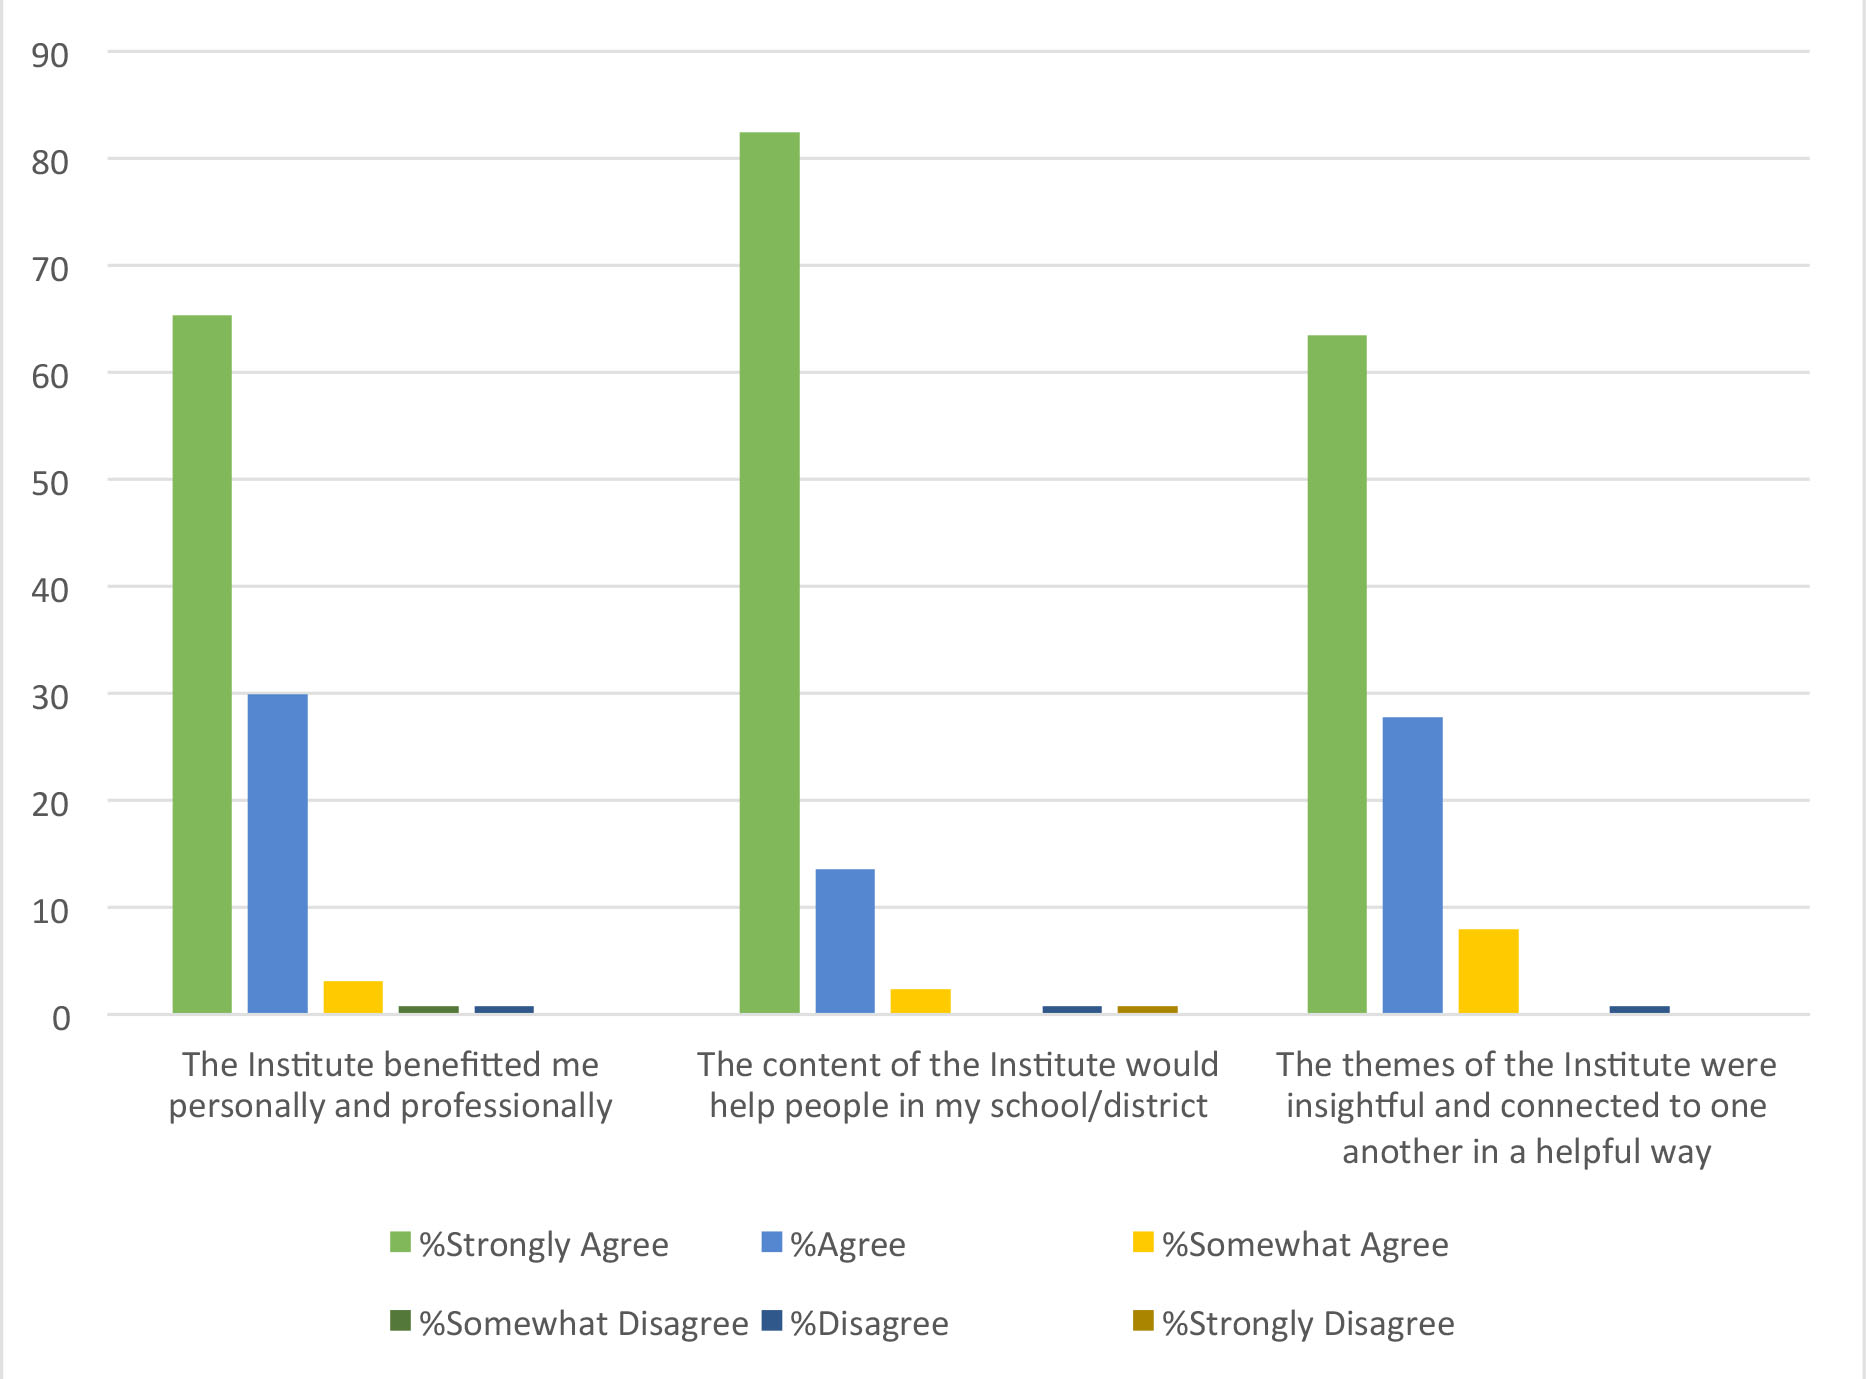
About 98 percent agreed that the Institute content was both beneficial to them personally and professionally and would be helpful to people in their school or district. Another 89 percent agreed that the themes of the Institute were insightful and connected in a helpful way.
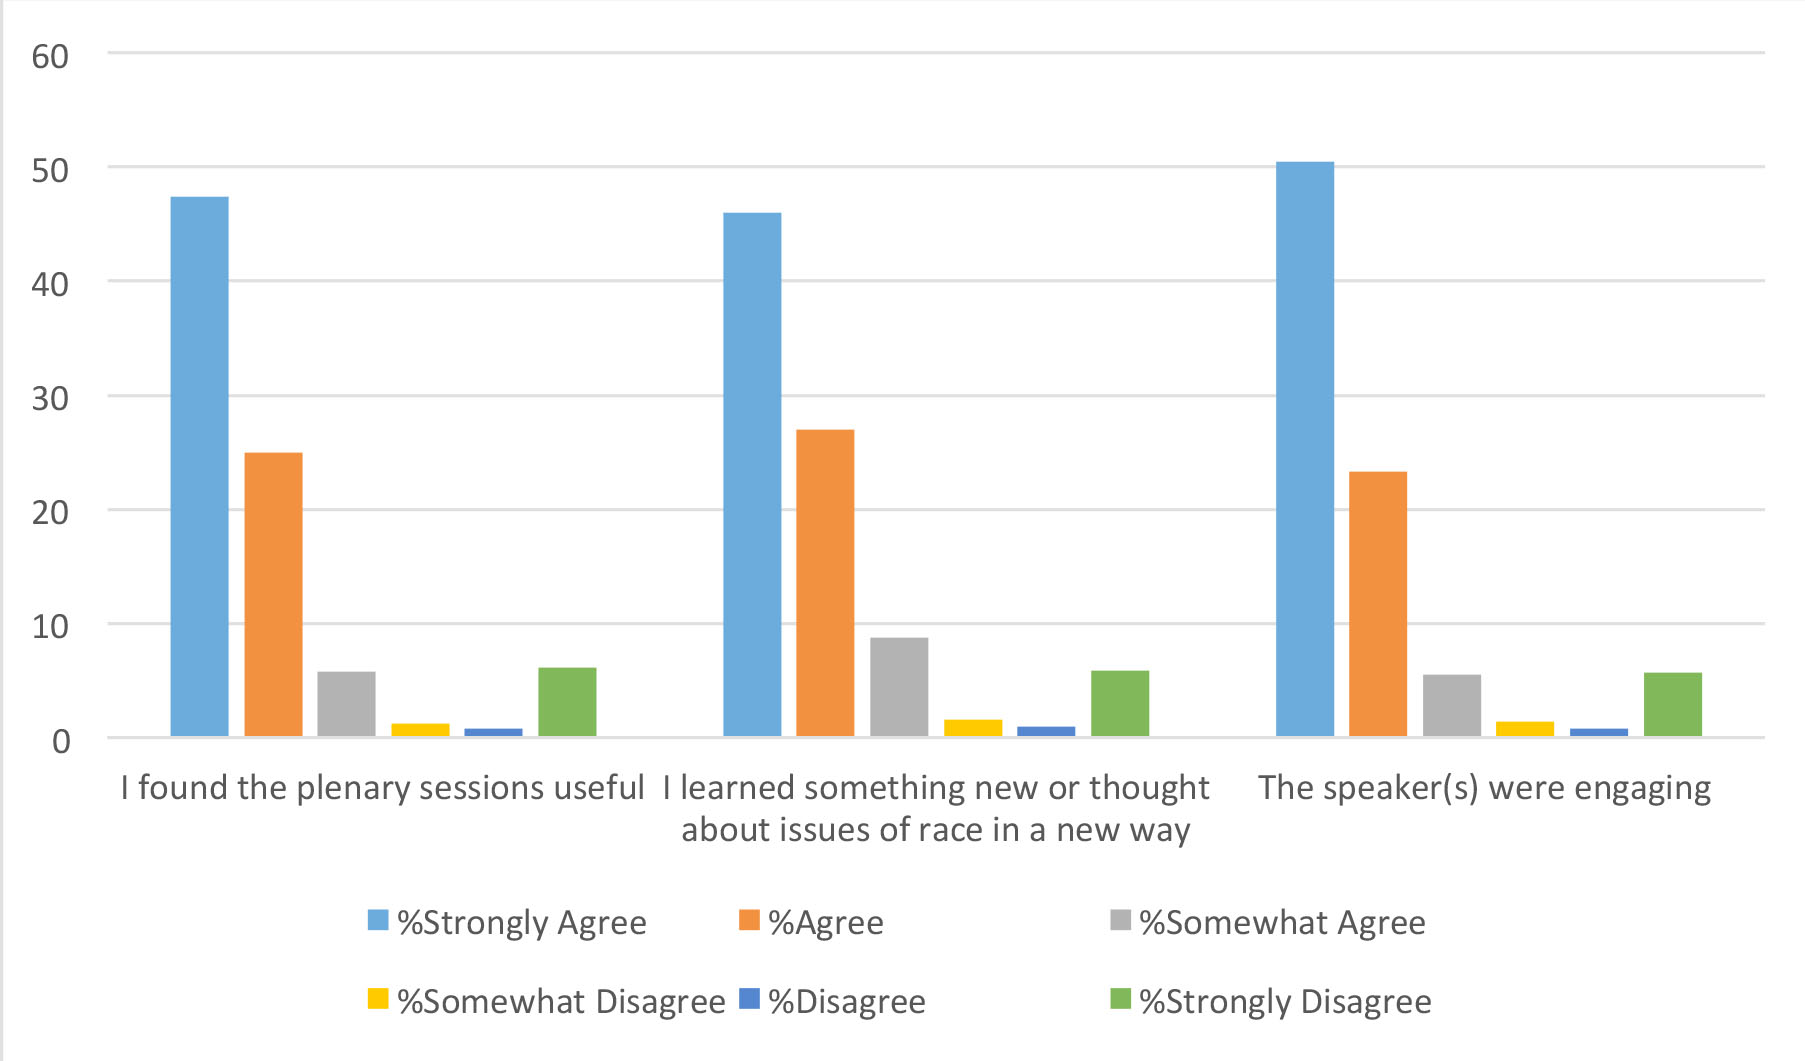
For those who attended the plenary sessions, about 78 percent found them useful and 82 percent learned something new or thought about issues of race in a new way. About 79 percent also found the plenary speakers engaging.
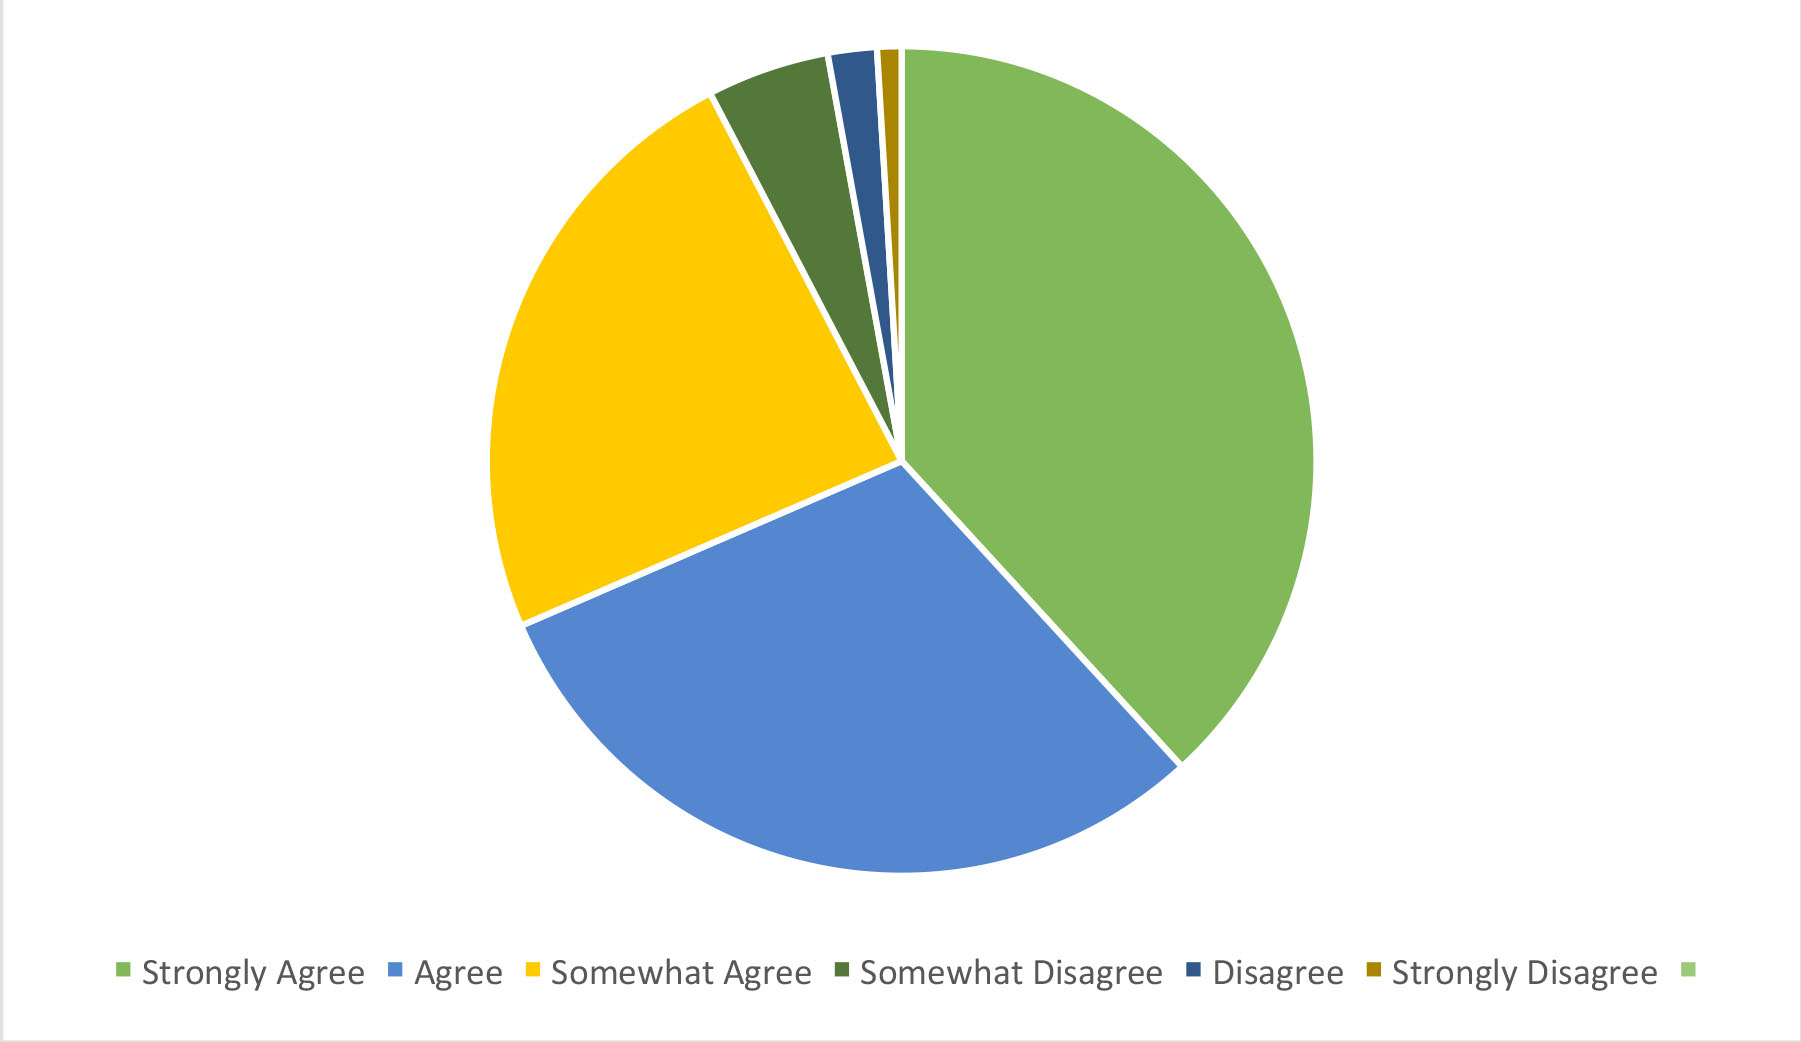
About 91 percent agreed (strongly agreed to somewhat agreed) that their pool party session was helpful to their thinking about diversity within the context of the work they do in education.
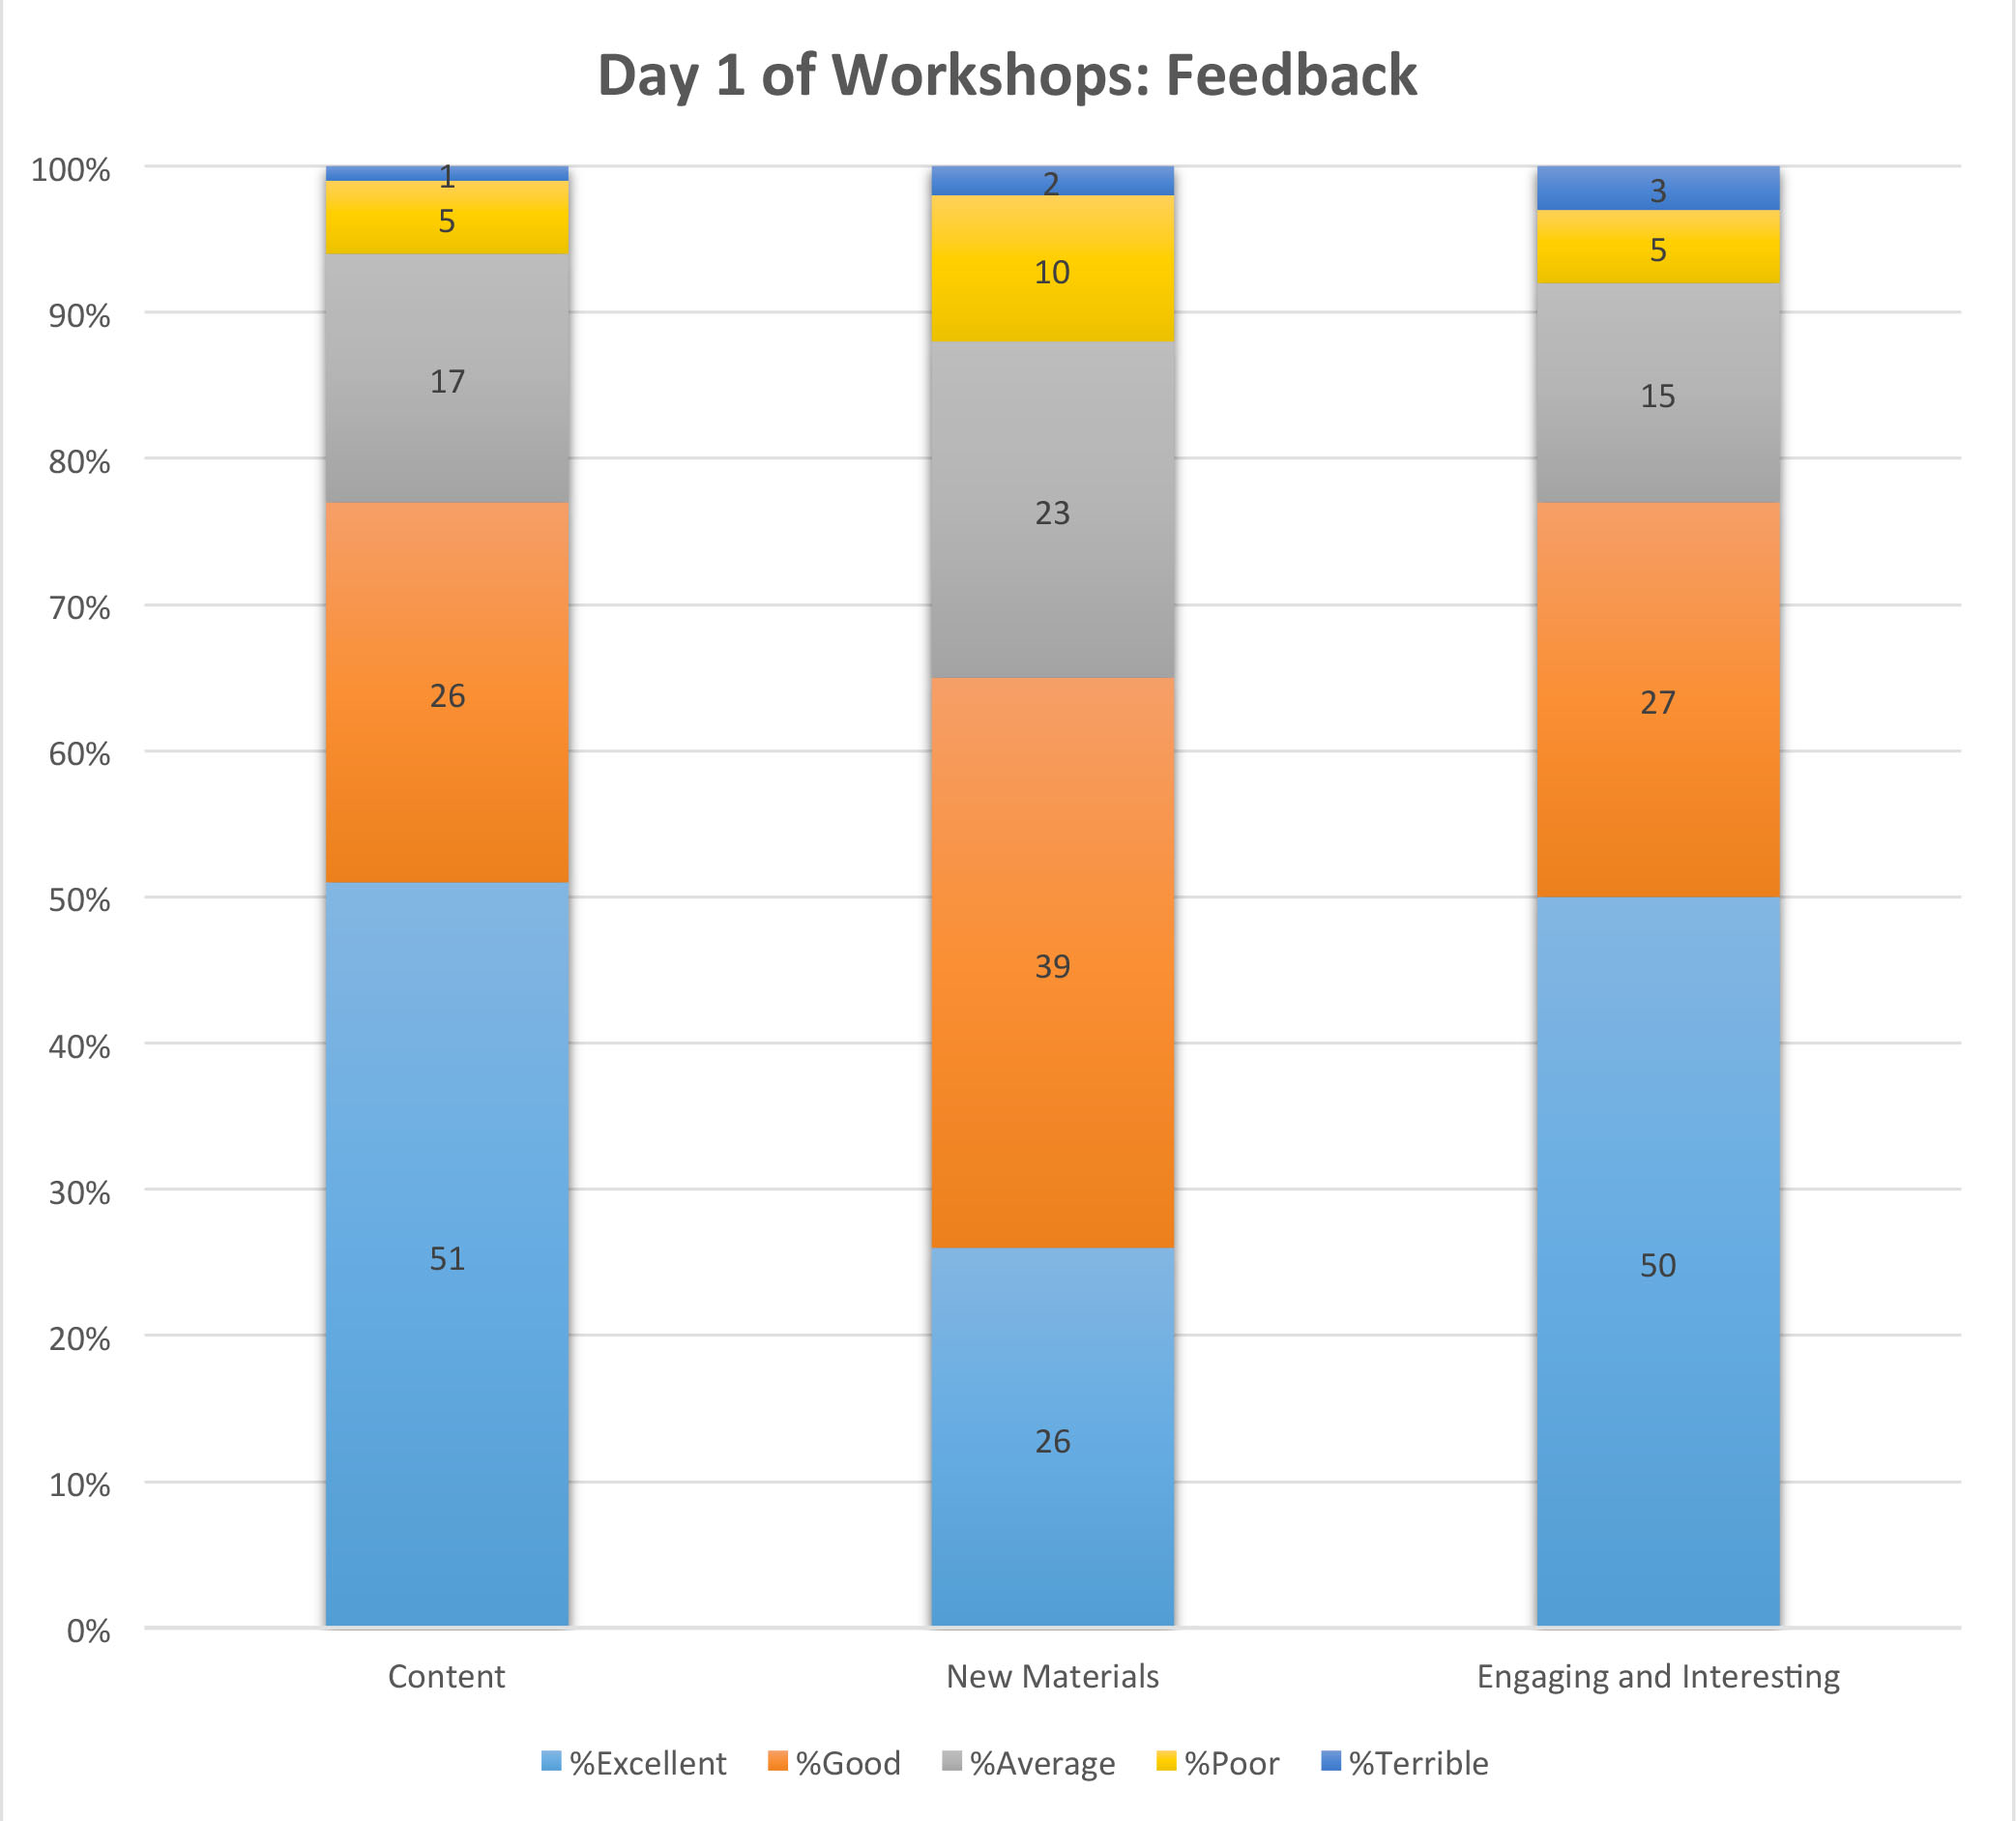
For Day 1, about 77 percent found the content of their workshop to be excellent or good, and 64 percent found the new materials to be excellent or good. About 77 percent of these attendees found the level of engagement and interest of their workshop to be excellent or good.
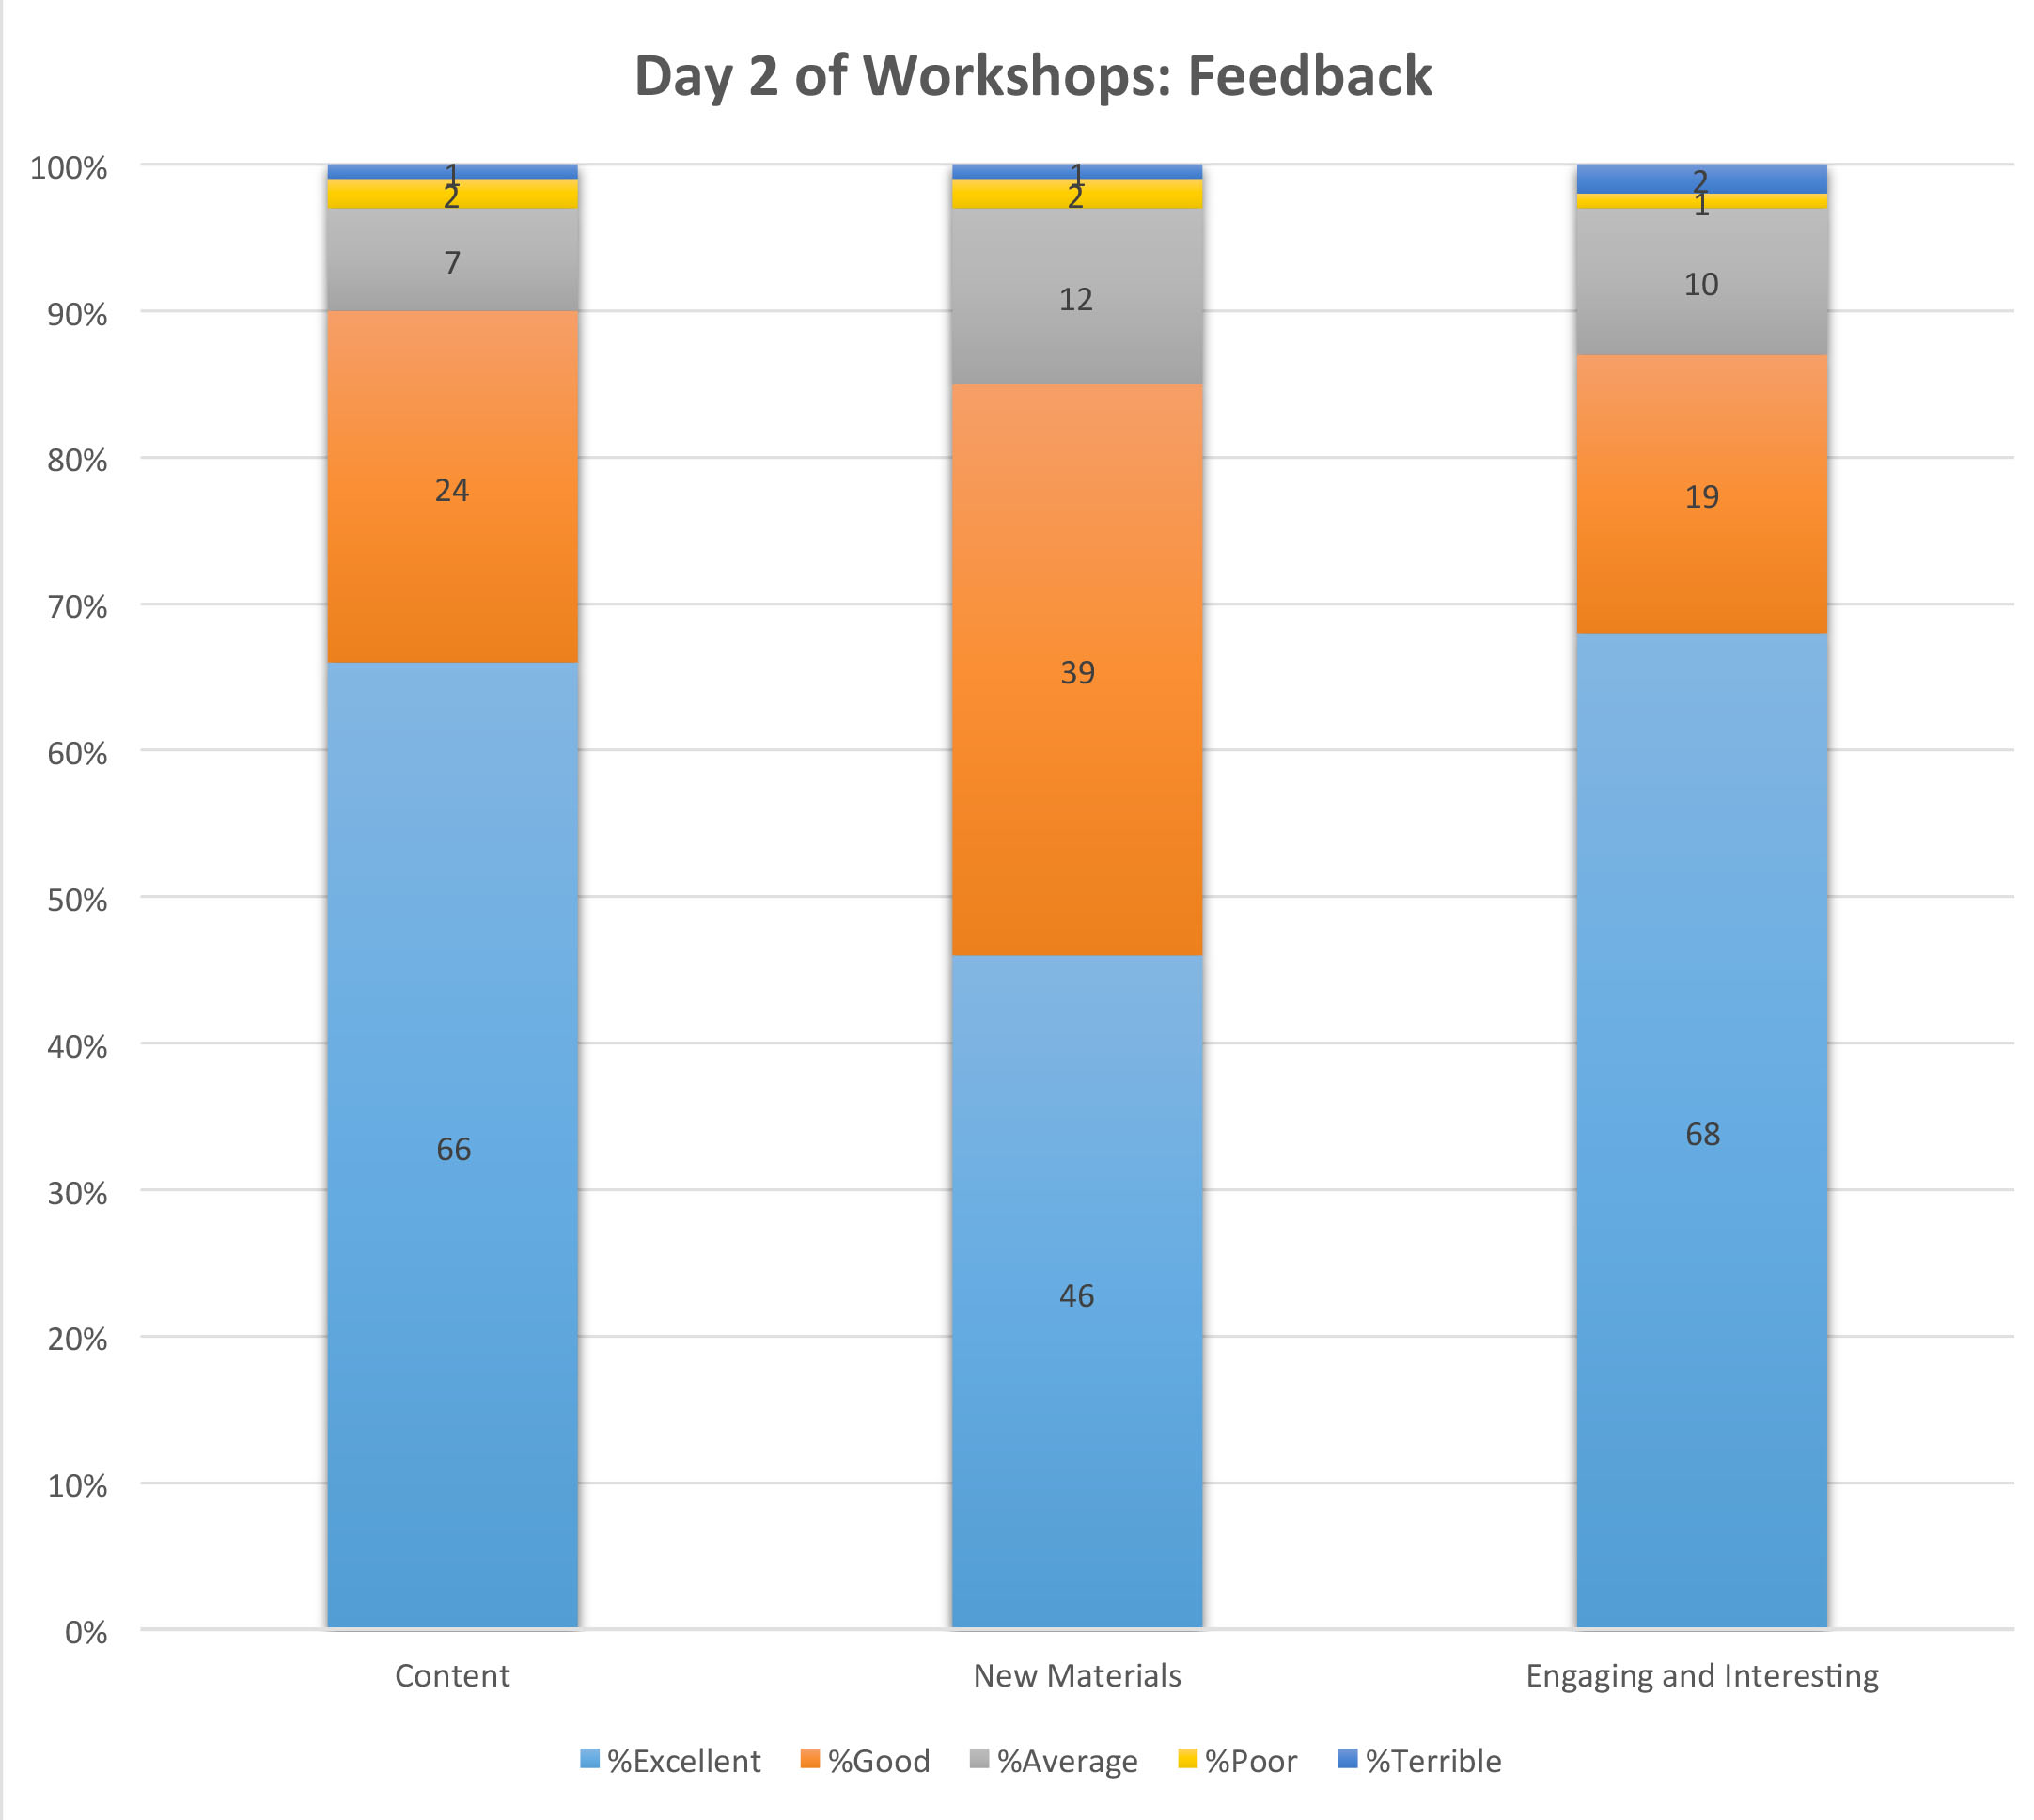
For Day 2, about 90 percent found the content of their workshop to be excellent or good and 85 percent found the new materials to be excellent or good. About 87 percent of these attendees found the level of engagement and interest of their workshop to be excellent or good.
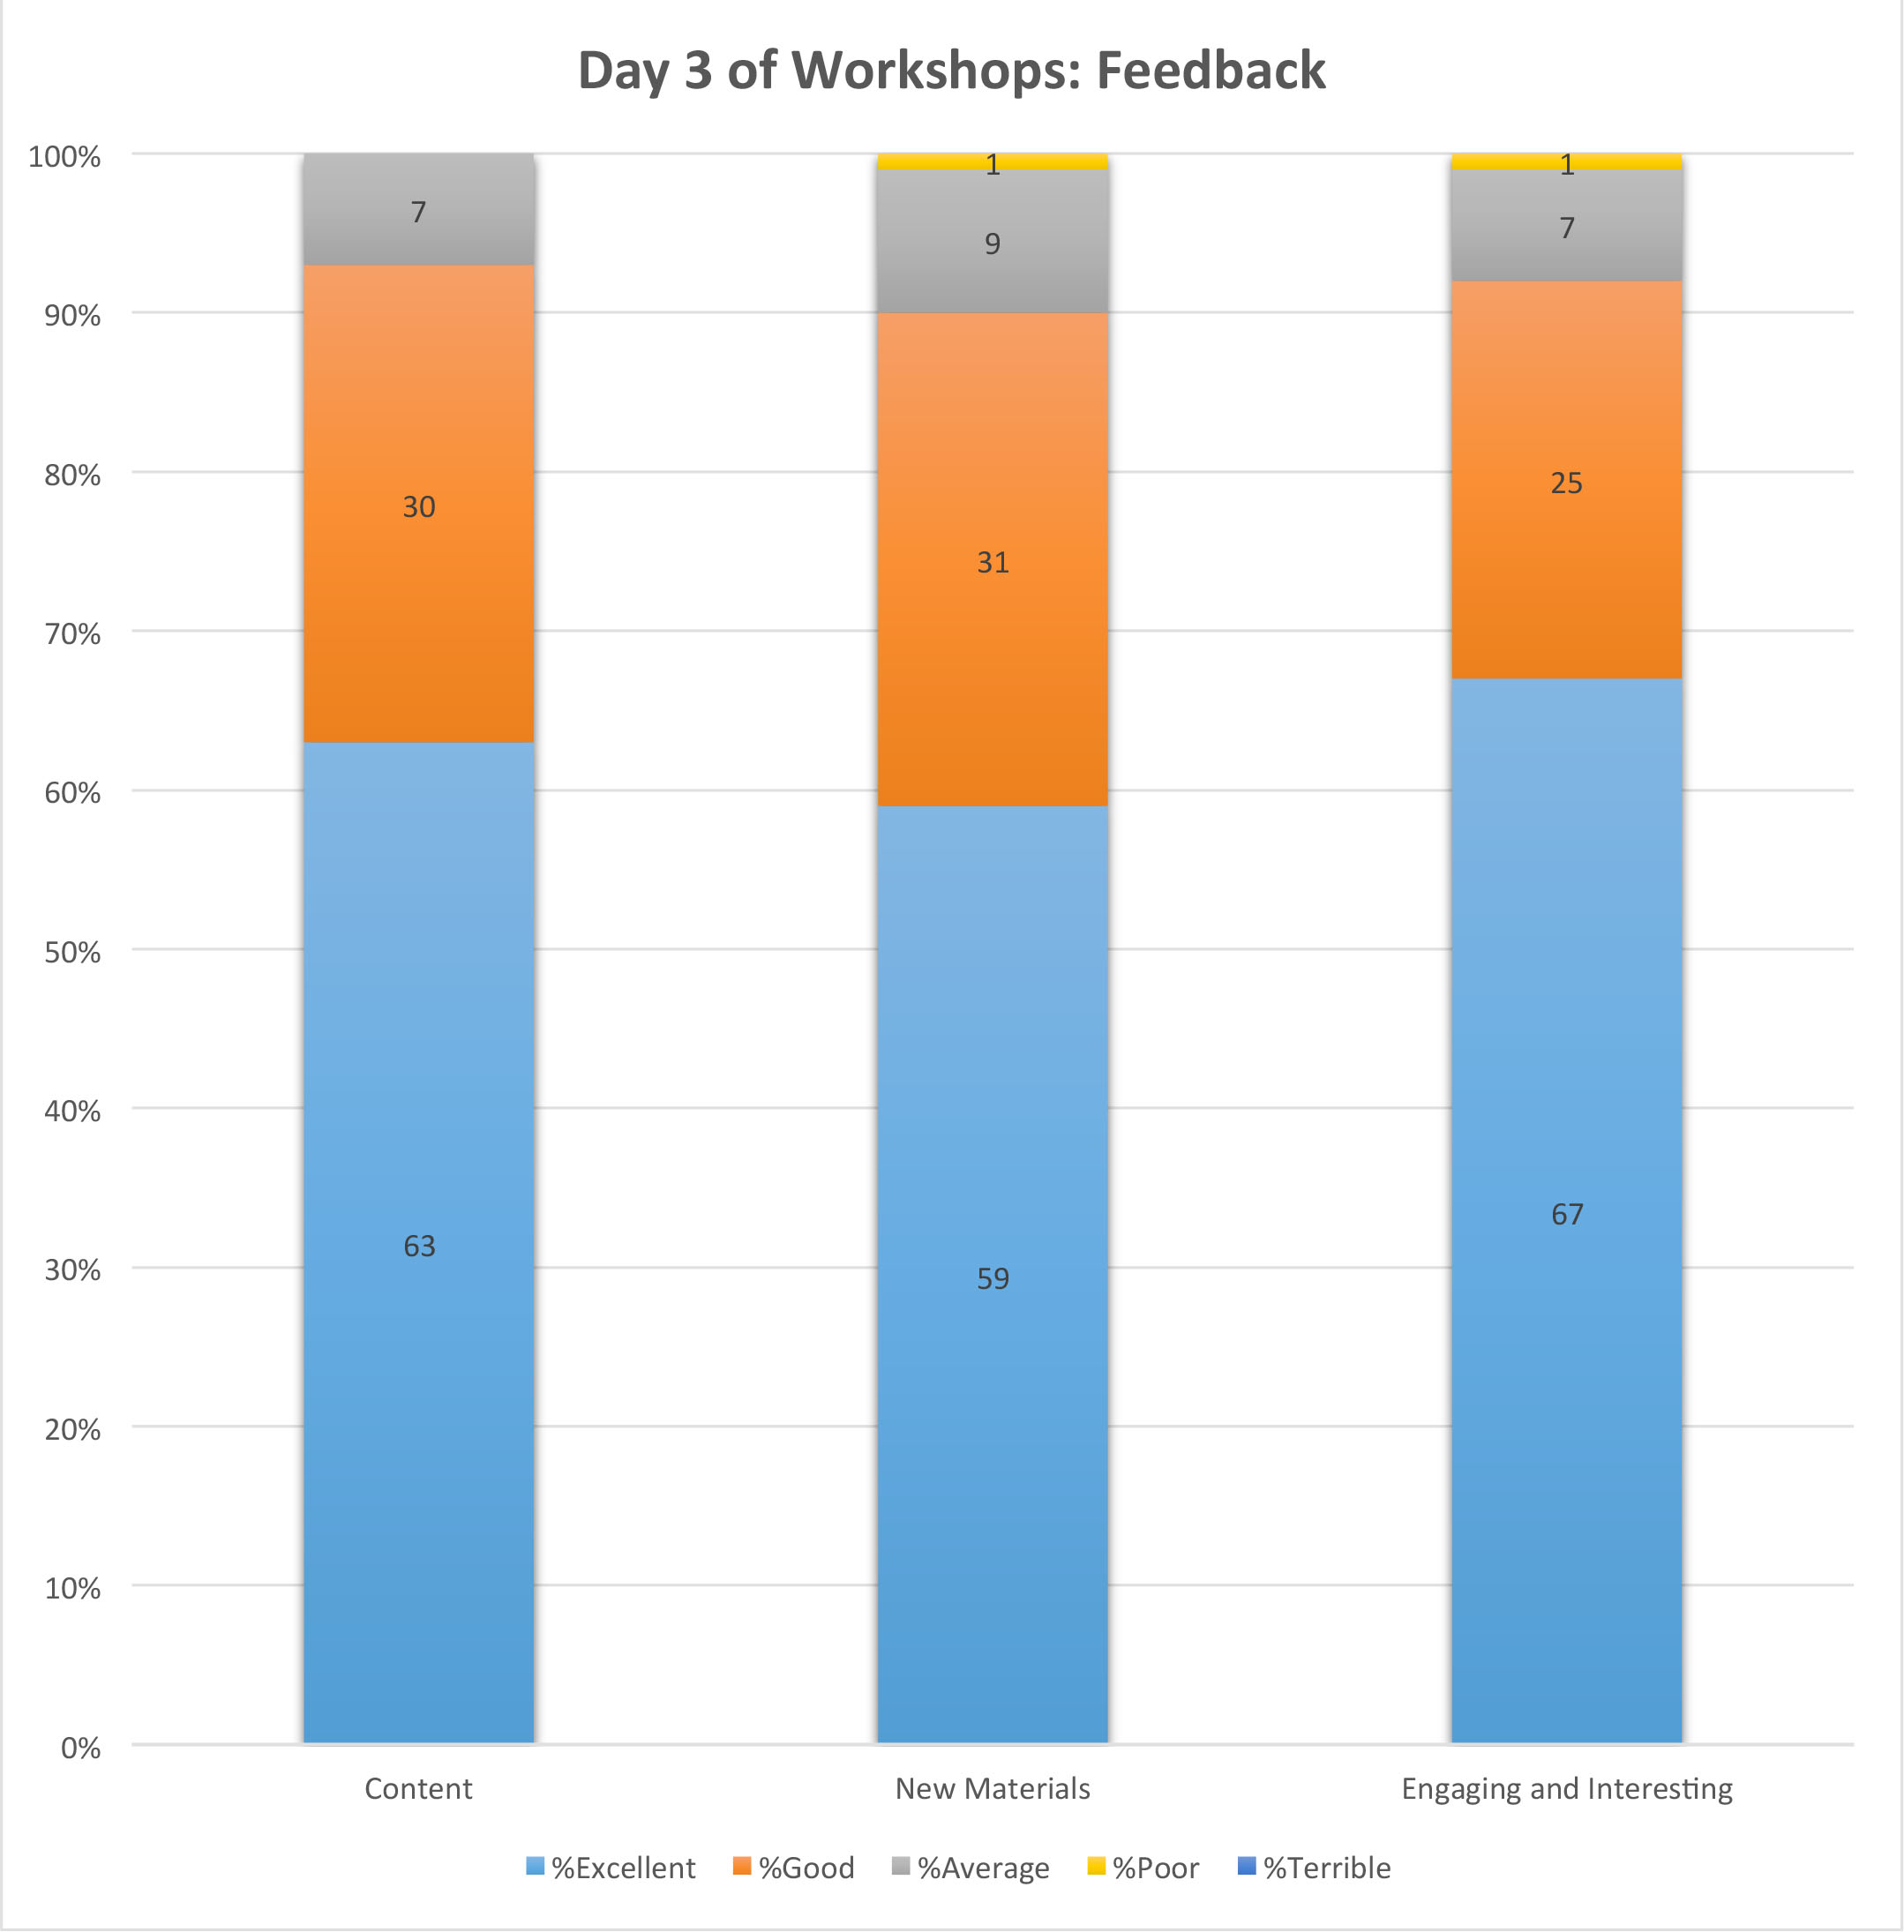
For Day 3, about 93 percent found the content of their workshop to be excellent or good and 89 percent found the new materials to be excellent or good. About 92 percent of these attendees found the level of engagement and interest of their workshop to be excellent or good.
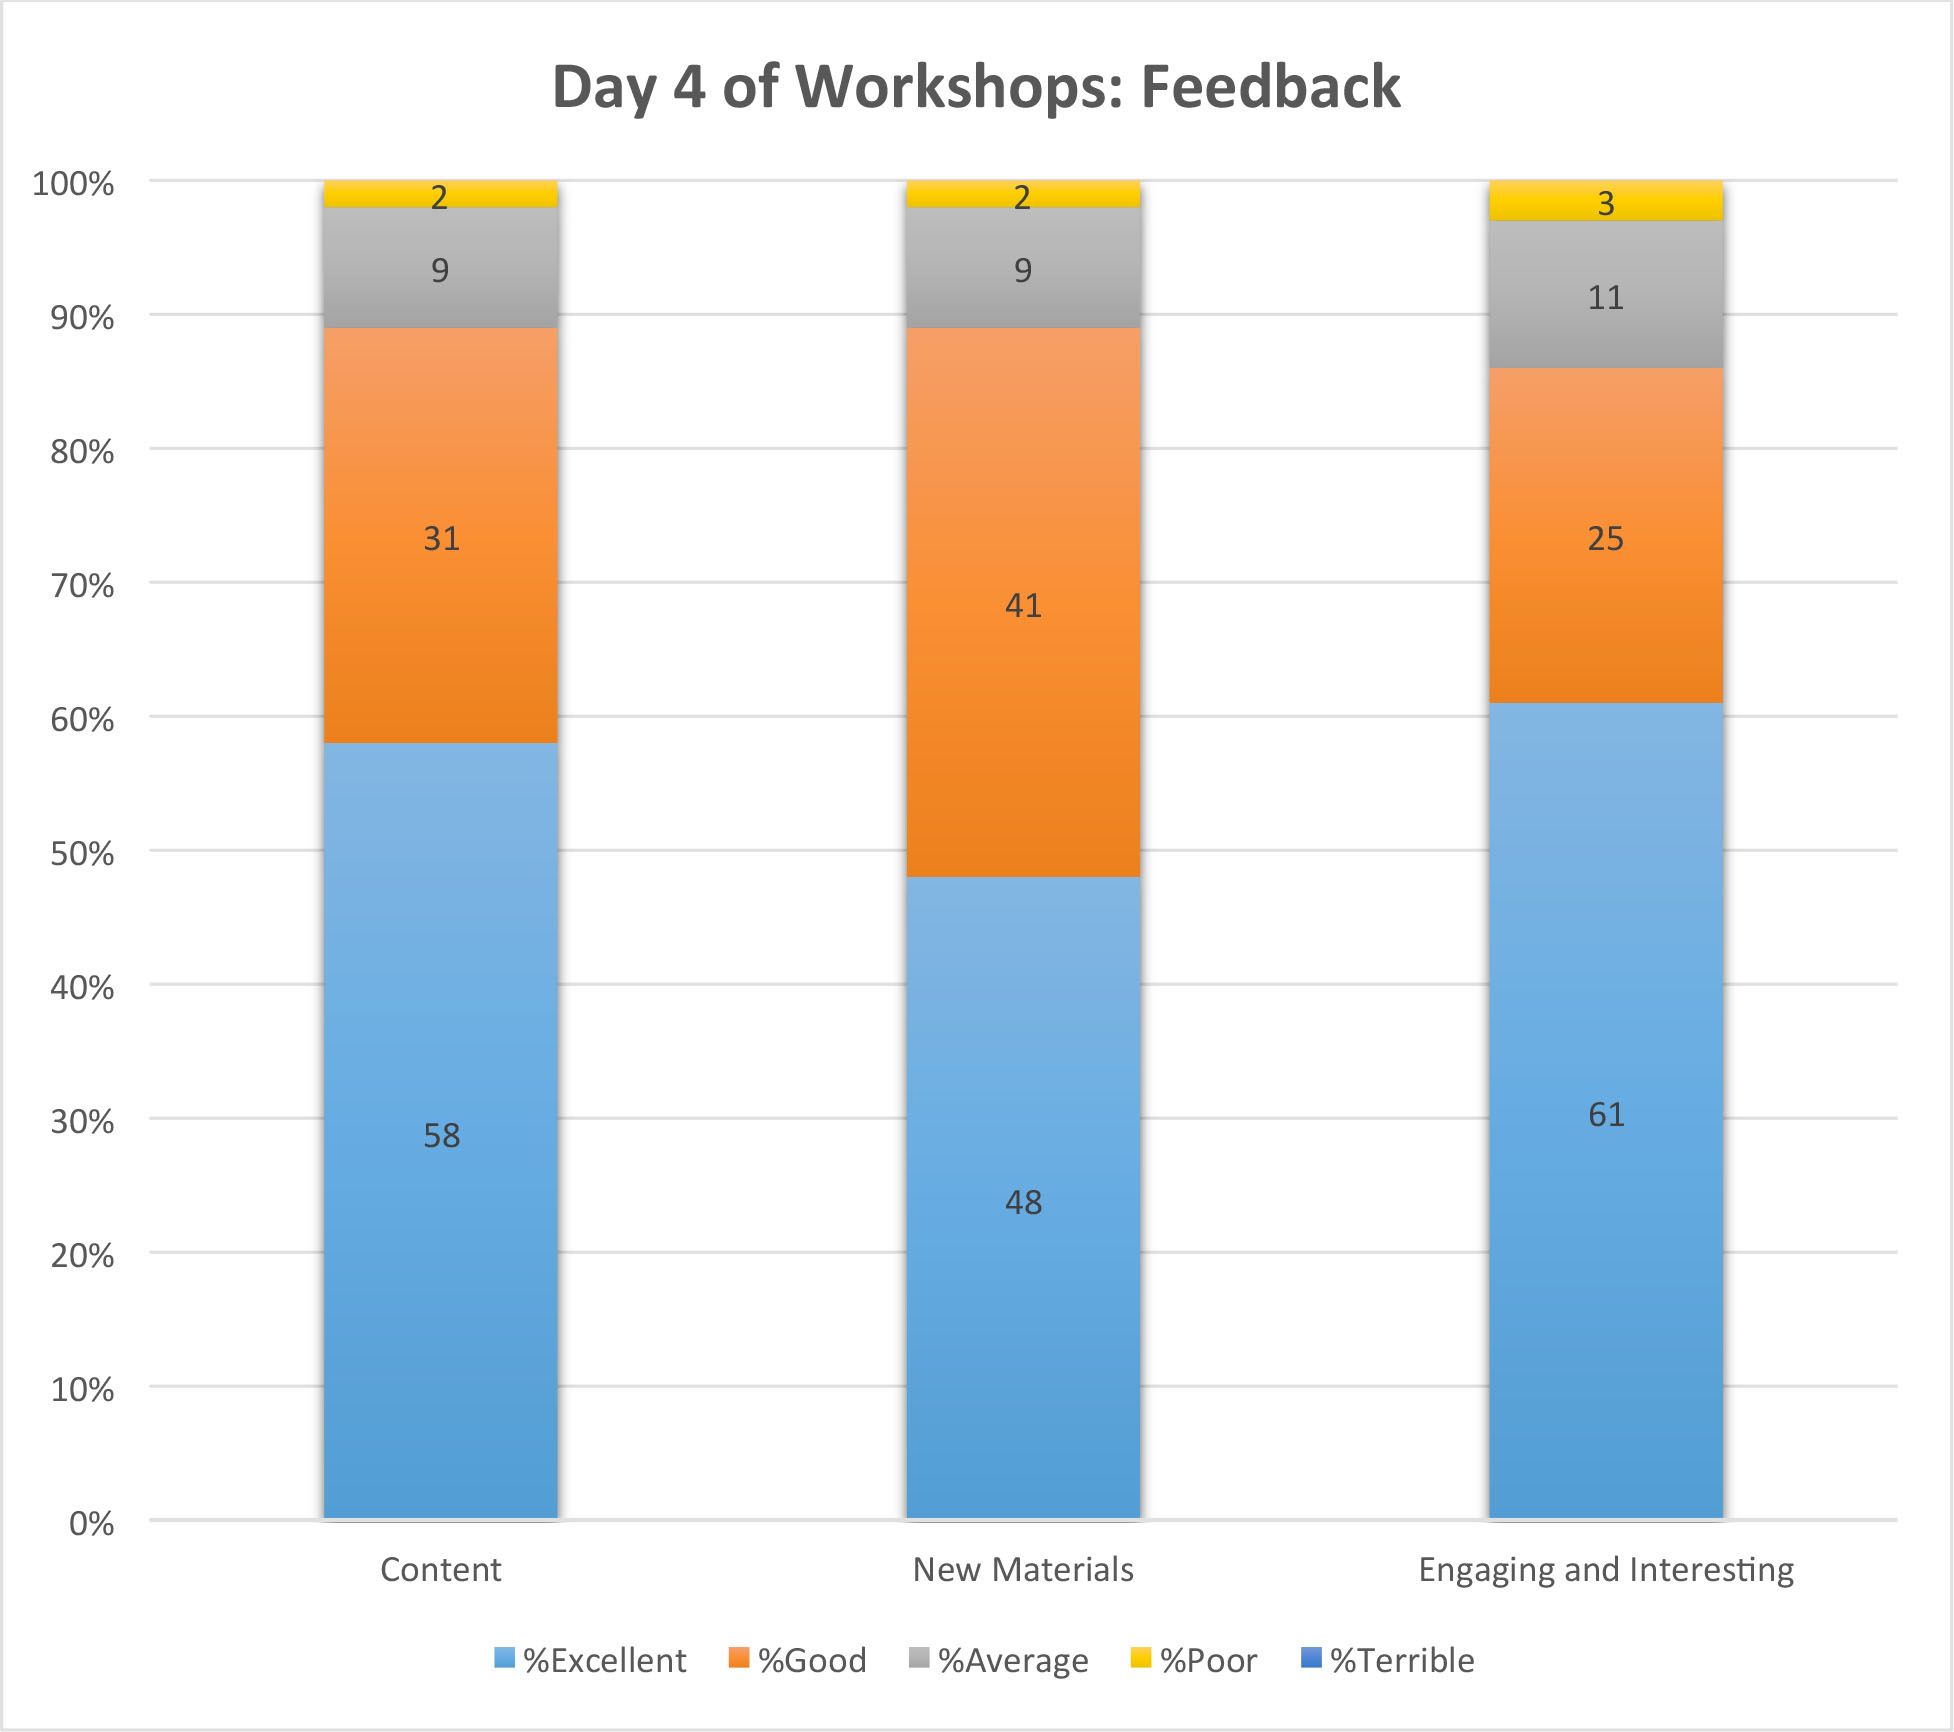
For Day 4, about 89% found the content of their workshop to be excellent or good and 88 percent found the new materials to be excellent or good. About 86% of these attendees found the level of engagement and interest of their workshop to be excellent or good.