Visualization
Dynamic network charts (Westaby, 2012), which we also now refer to as "network goal graphs" (Westaby & Shon, 2017) or "network goal analysis" (Westaby & Parr, 2020), are used to visualize how social networks influence goal pursuits. We use this terminology to help distinguish the approach from traditional sociograms/social network analysis (SNA), which does not incorporate goal nodes within network structures. In the traditional approach, the social structure itself has been the focus, which is understandable, justified, and incredibly important in many systems as discussed in Westaby et al. (2014). However, by inserting goal nodes into network goal analysis, a helpful new way to understand complex human behavior can be attained, since goals, wishes, and desires drive much human action as well as the formation of social structures to help (or hinder) that action. It's presumed to be the heart of human behavior.
Using goal nodes in network goal analysis is also helpful because it shows how the network is influencing the goal independently (e.g., individual striving) or inter-dependently (e.g., a person distally helping someone else's goal pursuit). To see how this differs from traditional social network analysis and organizational charts, click here.
There are various ways to create and visualize these network goal systems, such as through computer visualization, our main focus, and manual approaches, which are useful to quickly portray human dynamics of myriad types.
Network Goal Analysis
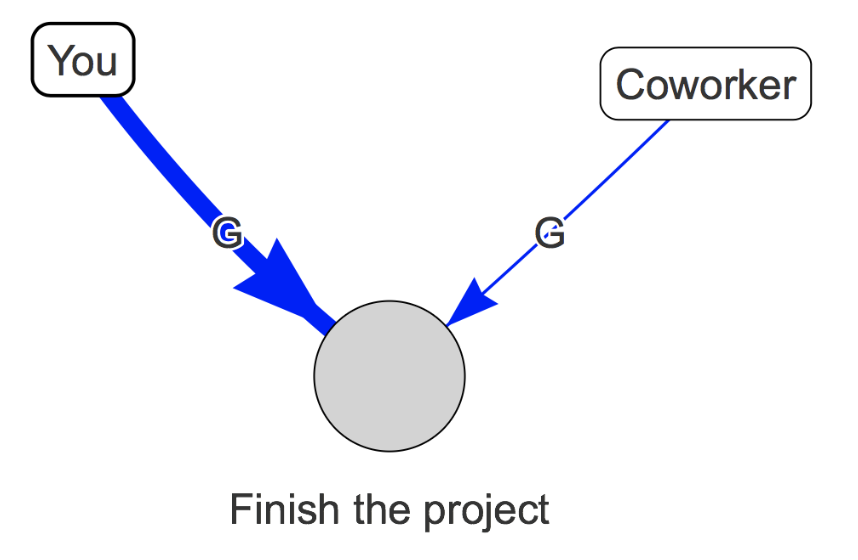
The Goal Striving Sub-Network
- This is new conceptualizing based on dynamic network theory (Westaby and colleagues). This accounts for our independent efforts to strive for our goals, interests, desires, wishes, dreams, etc.
- G = Goal striving links
- Squares = entities
- Ovals = focal goal
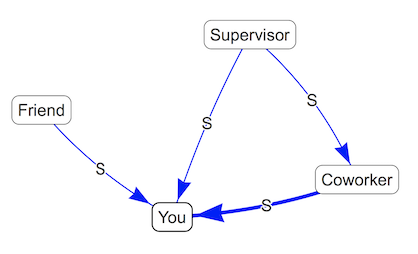
The System Support Sub-Network
- This is more akin to a traditional social network analysis (with no goal node). However, we theoretically contextualize this support to the goal context under study as well, which provides a unique perspective, grounded in behavioral intention theorizing (and the importance of "correspondence" in Fishbein and Ajzen theorizing). DNT is the first to make this complete synergy between networks and goals/target behaviors.
- S = system support links
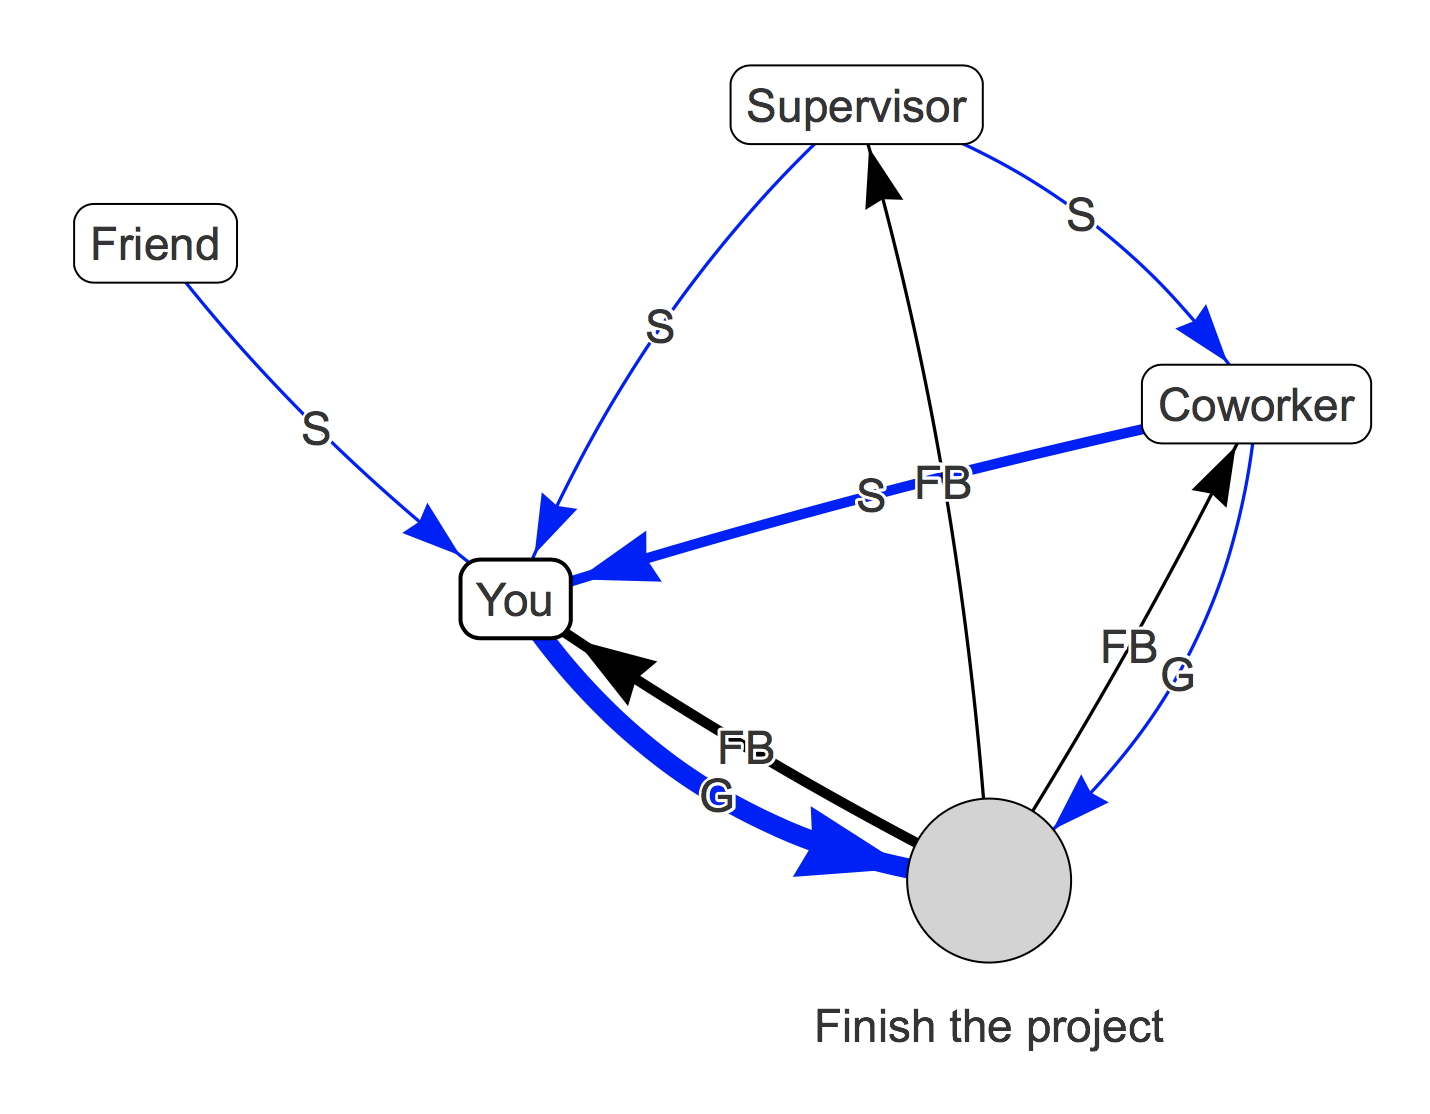
The Network Motivation Sub-Network (aka "goal pursuit links")
- Network motivation is also a new conceptualization based on dynamic network theory. The goal node and striving is included with the system support network in this network goal analysis of this motivational sub-network. Feedback from the task is also now included in our theorizing, given its powerful role in motivation and self-regulation. But here, we see how it flows to those actually motivated in the network.
- FB = feedback linkages
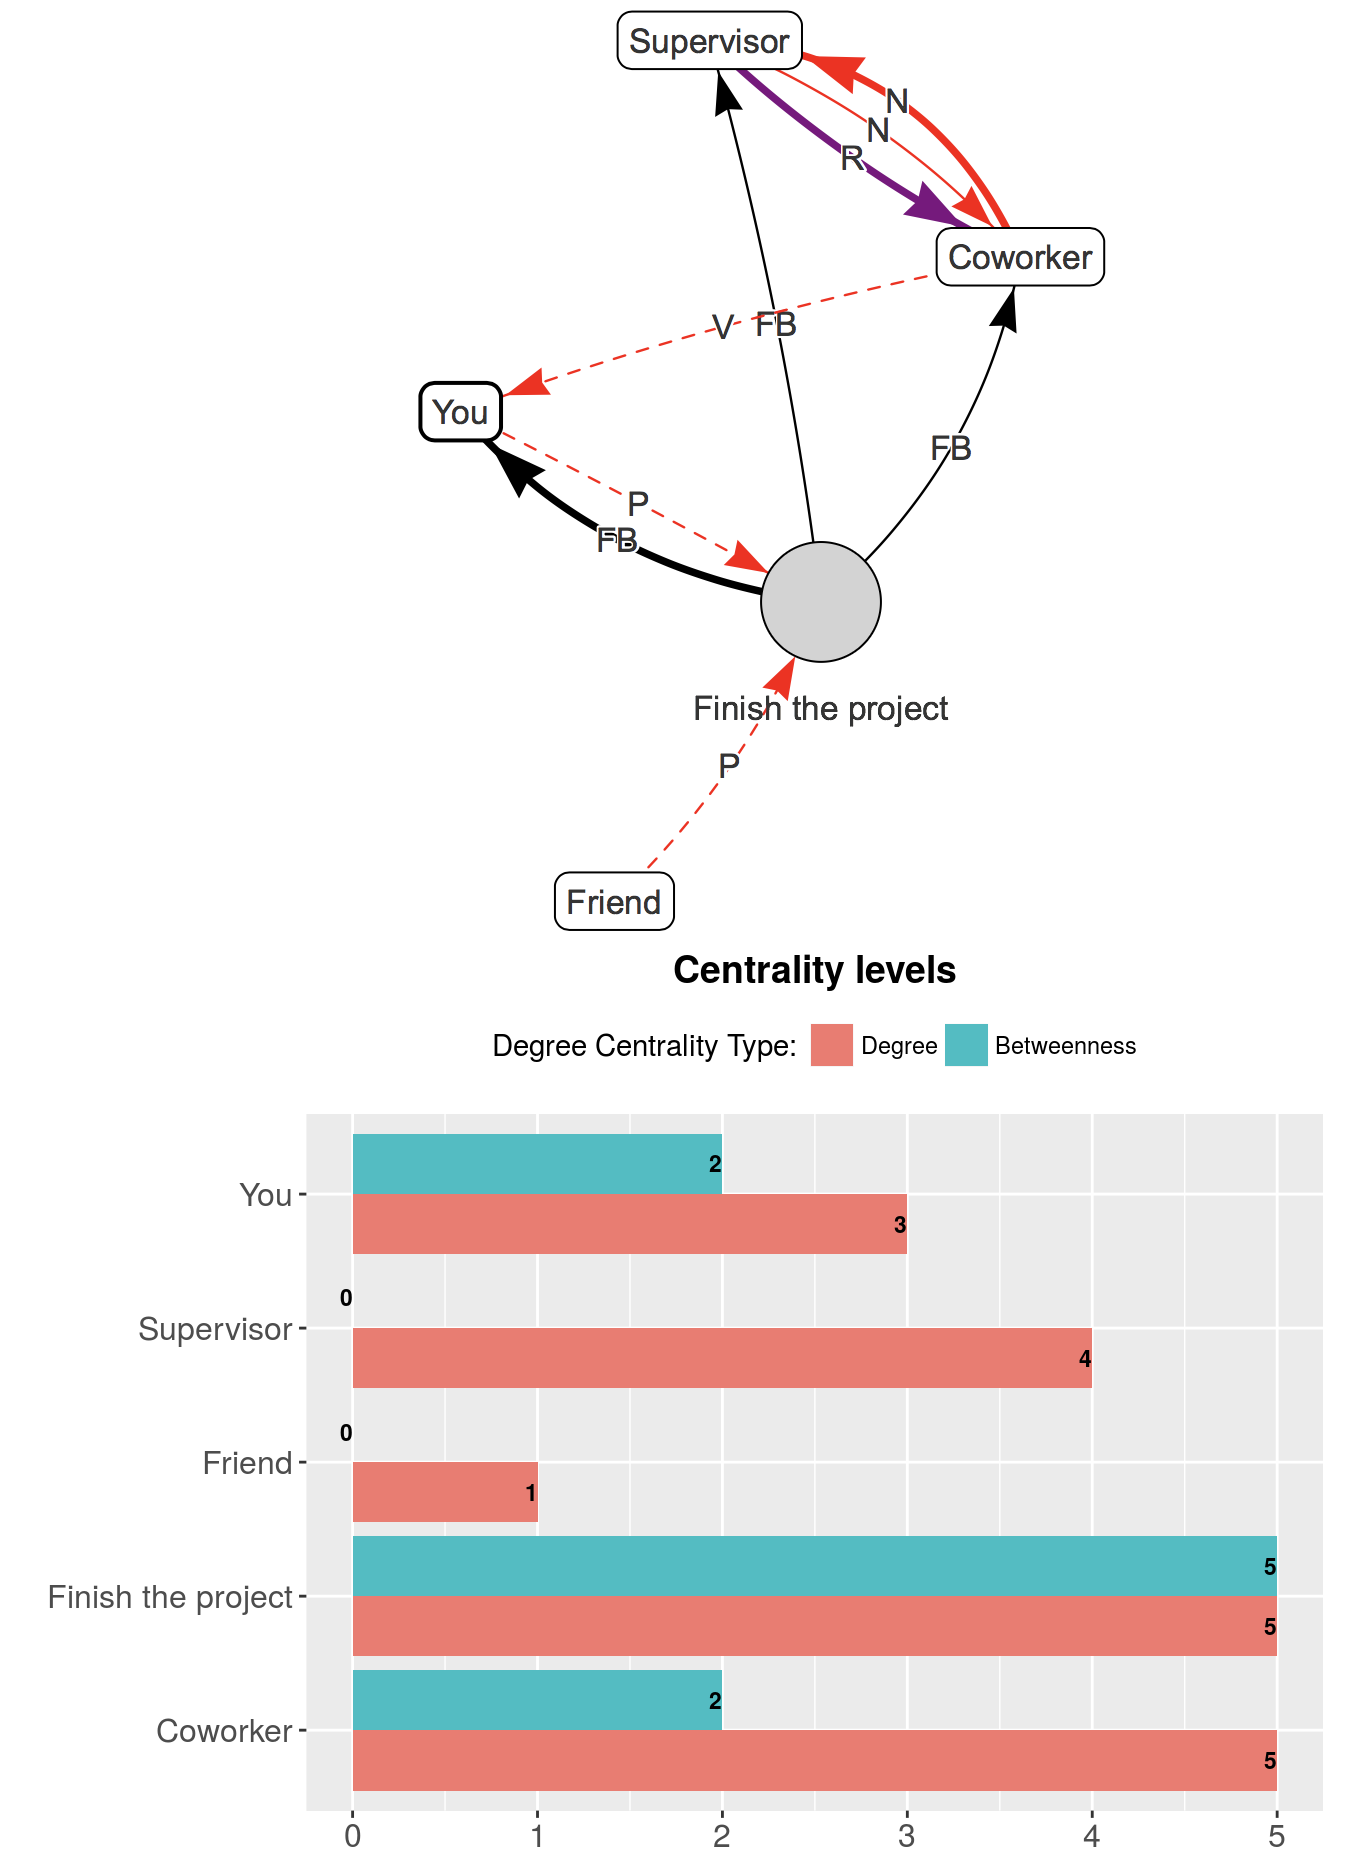
The Conflict Sub-Network with Centrality Indicators Illustrated
- This displays additional new concepts from dynamic network theory
- N = System negation (being upset about the goal pursuit). This has been generalized slightly in our newest formulation.
- R = System reactance (attempted constructive reactions to conflict in relation to the goal). This has also been slightly modified to capture this important constructive dynamic that happens in many human systems.
- Centrality indicators shown below as one illustration. Our reports provide them on all sub-networks and full system.
The Full System with Centrality Statistics Shown
- More new conceptualizing from dynamic network theory about the complete system of motivational factors involved with the goal node and direct goal striving and preventing efforts.
- Participants receiving reports can also click on any given entity in any graph to observe only that entity's connections. They are highlighted. This allows you to carefully understand how an entity is related (or not related) to everyone else in the network. It allows you to zoom in at the most micro entity level.
Implications in this simple example
- As one can see from the statistics, the goal is very central to this system along with some entities playing a more central social network role to the goal than others. This means that the goal (and its information about the task) is connecting people in the system through those trying to achieve it independently (G) or getting feedback from the processes associated with it (FB).
- Without a network goal analysis, these insights about complex systems would be more easily hidden. A DNT perspective makes this examination very explicit and allows us to visualize the system at multiple levels and different motivational angles.
Visualizing Massive Online Behavior (Westaby, 2020)
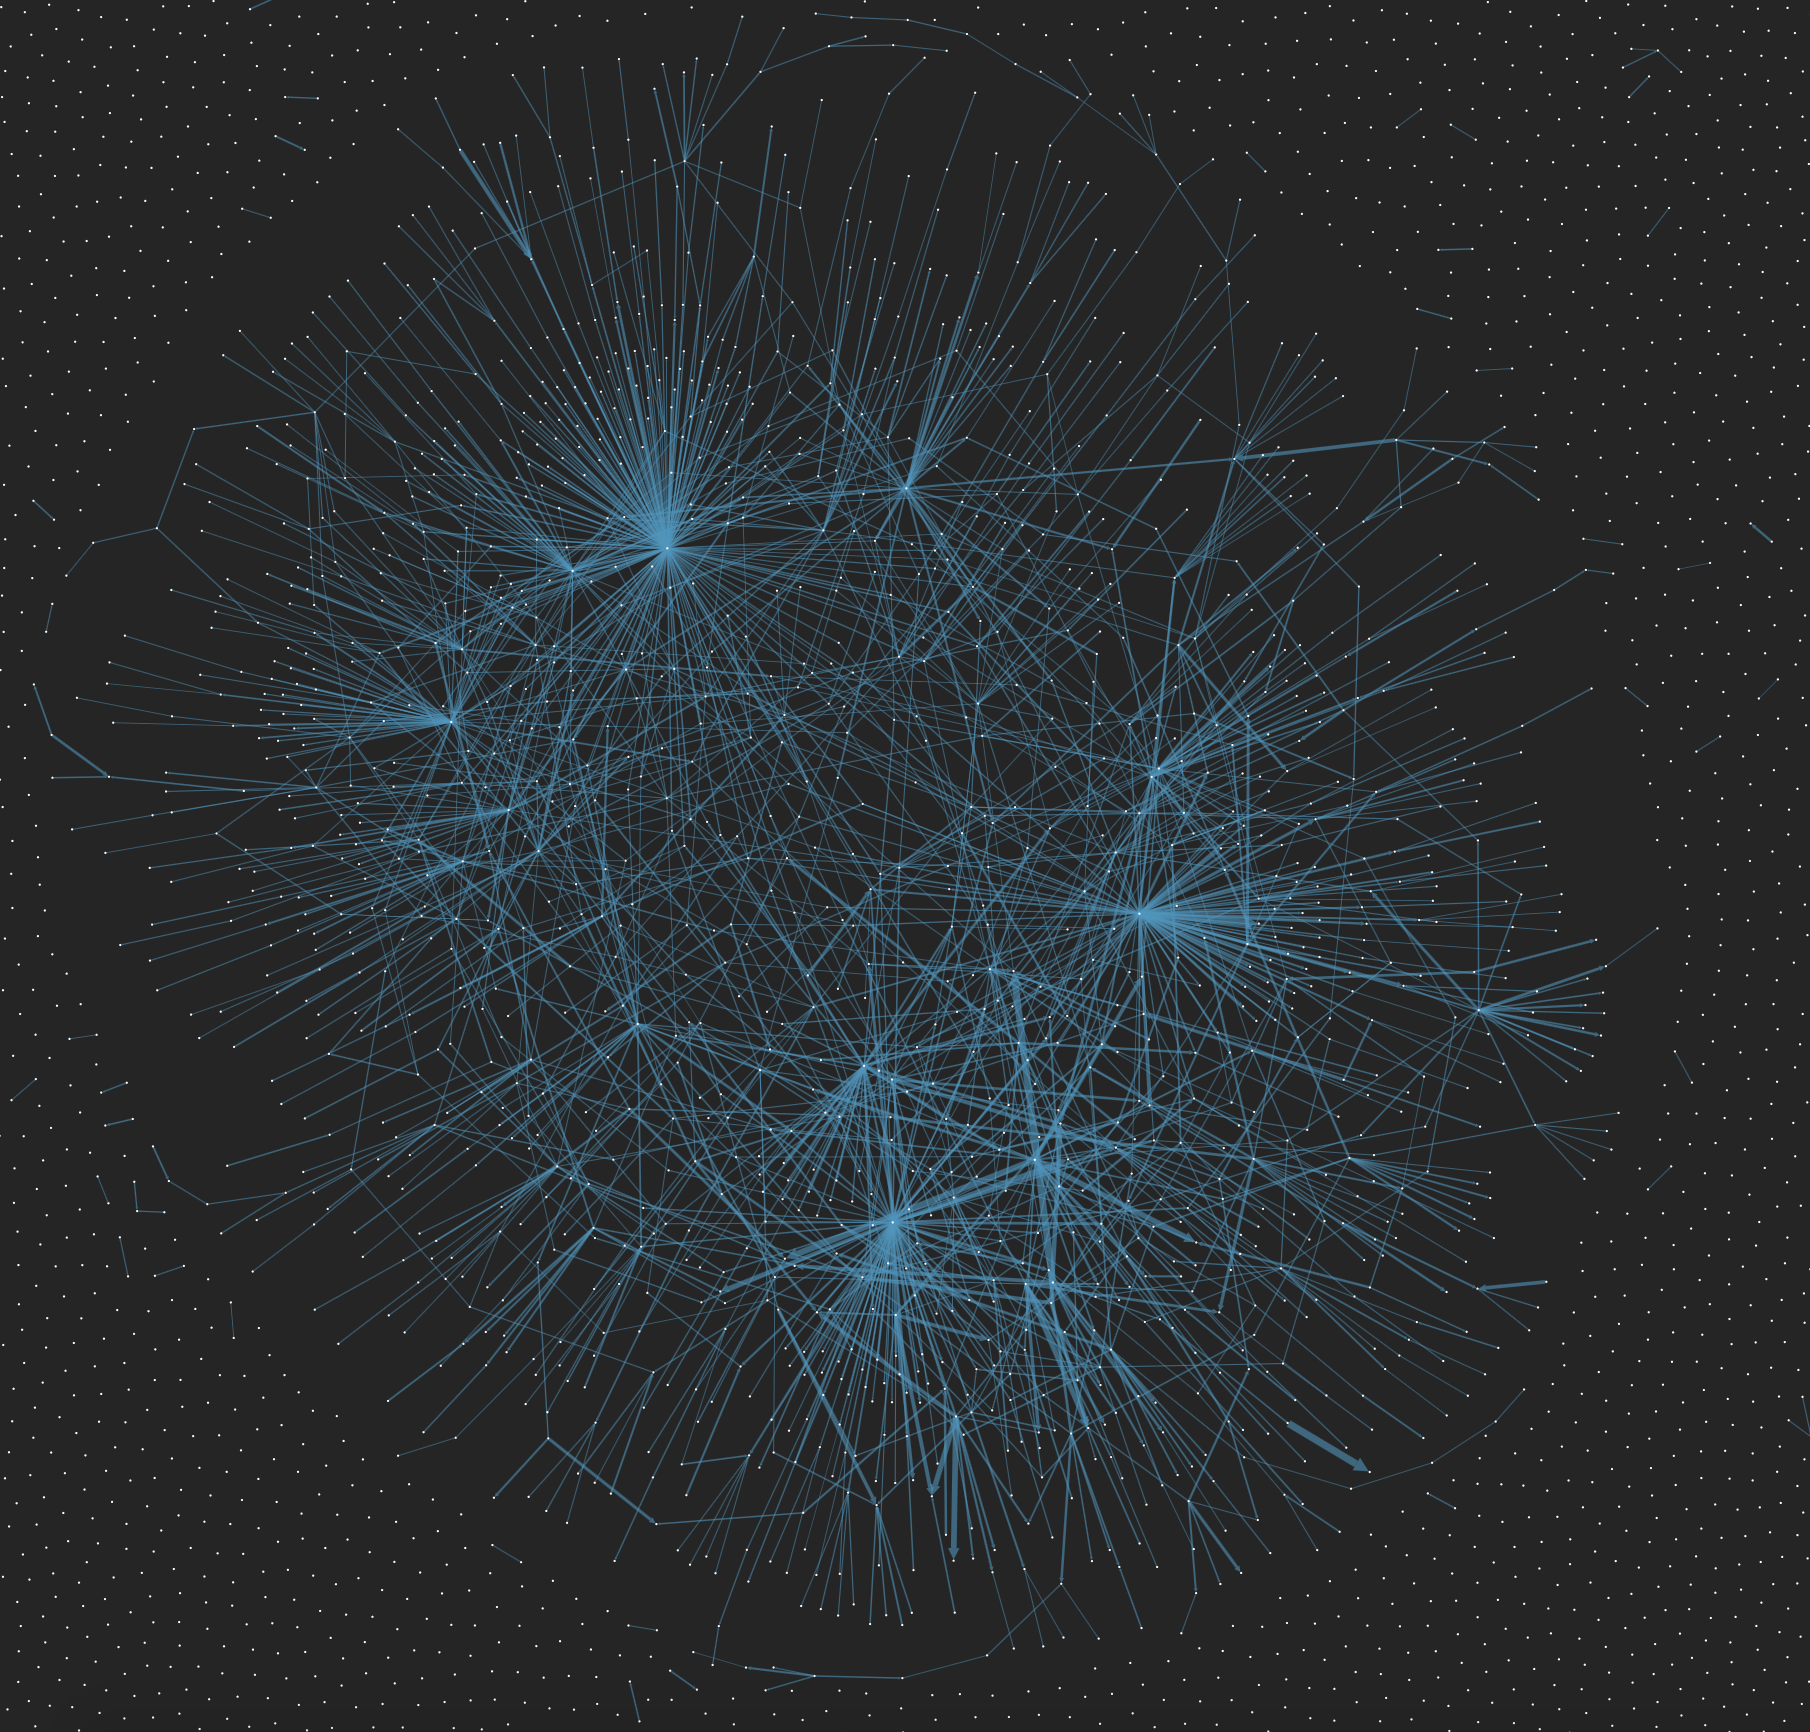
Goal Striving Structure on Multiple Goal Node Questions/Topics
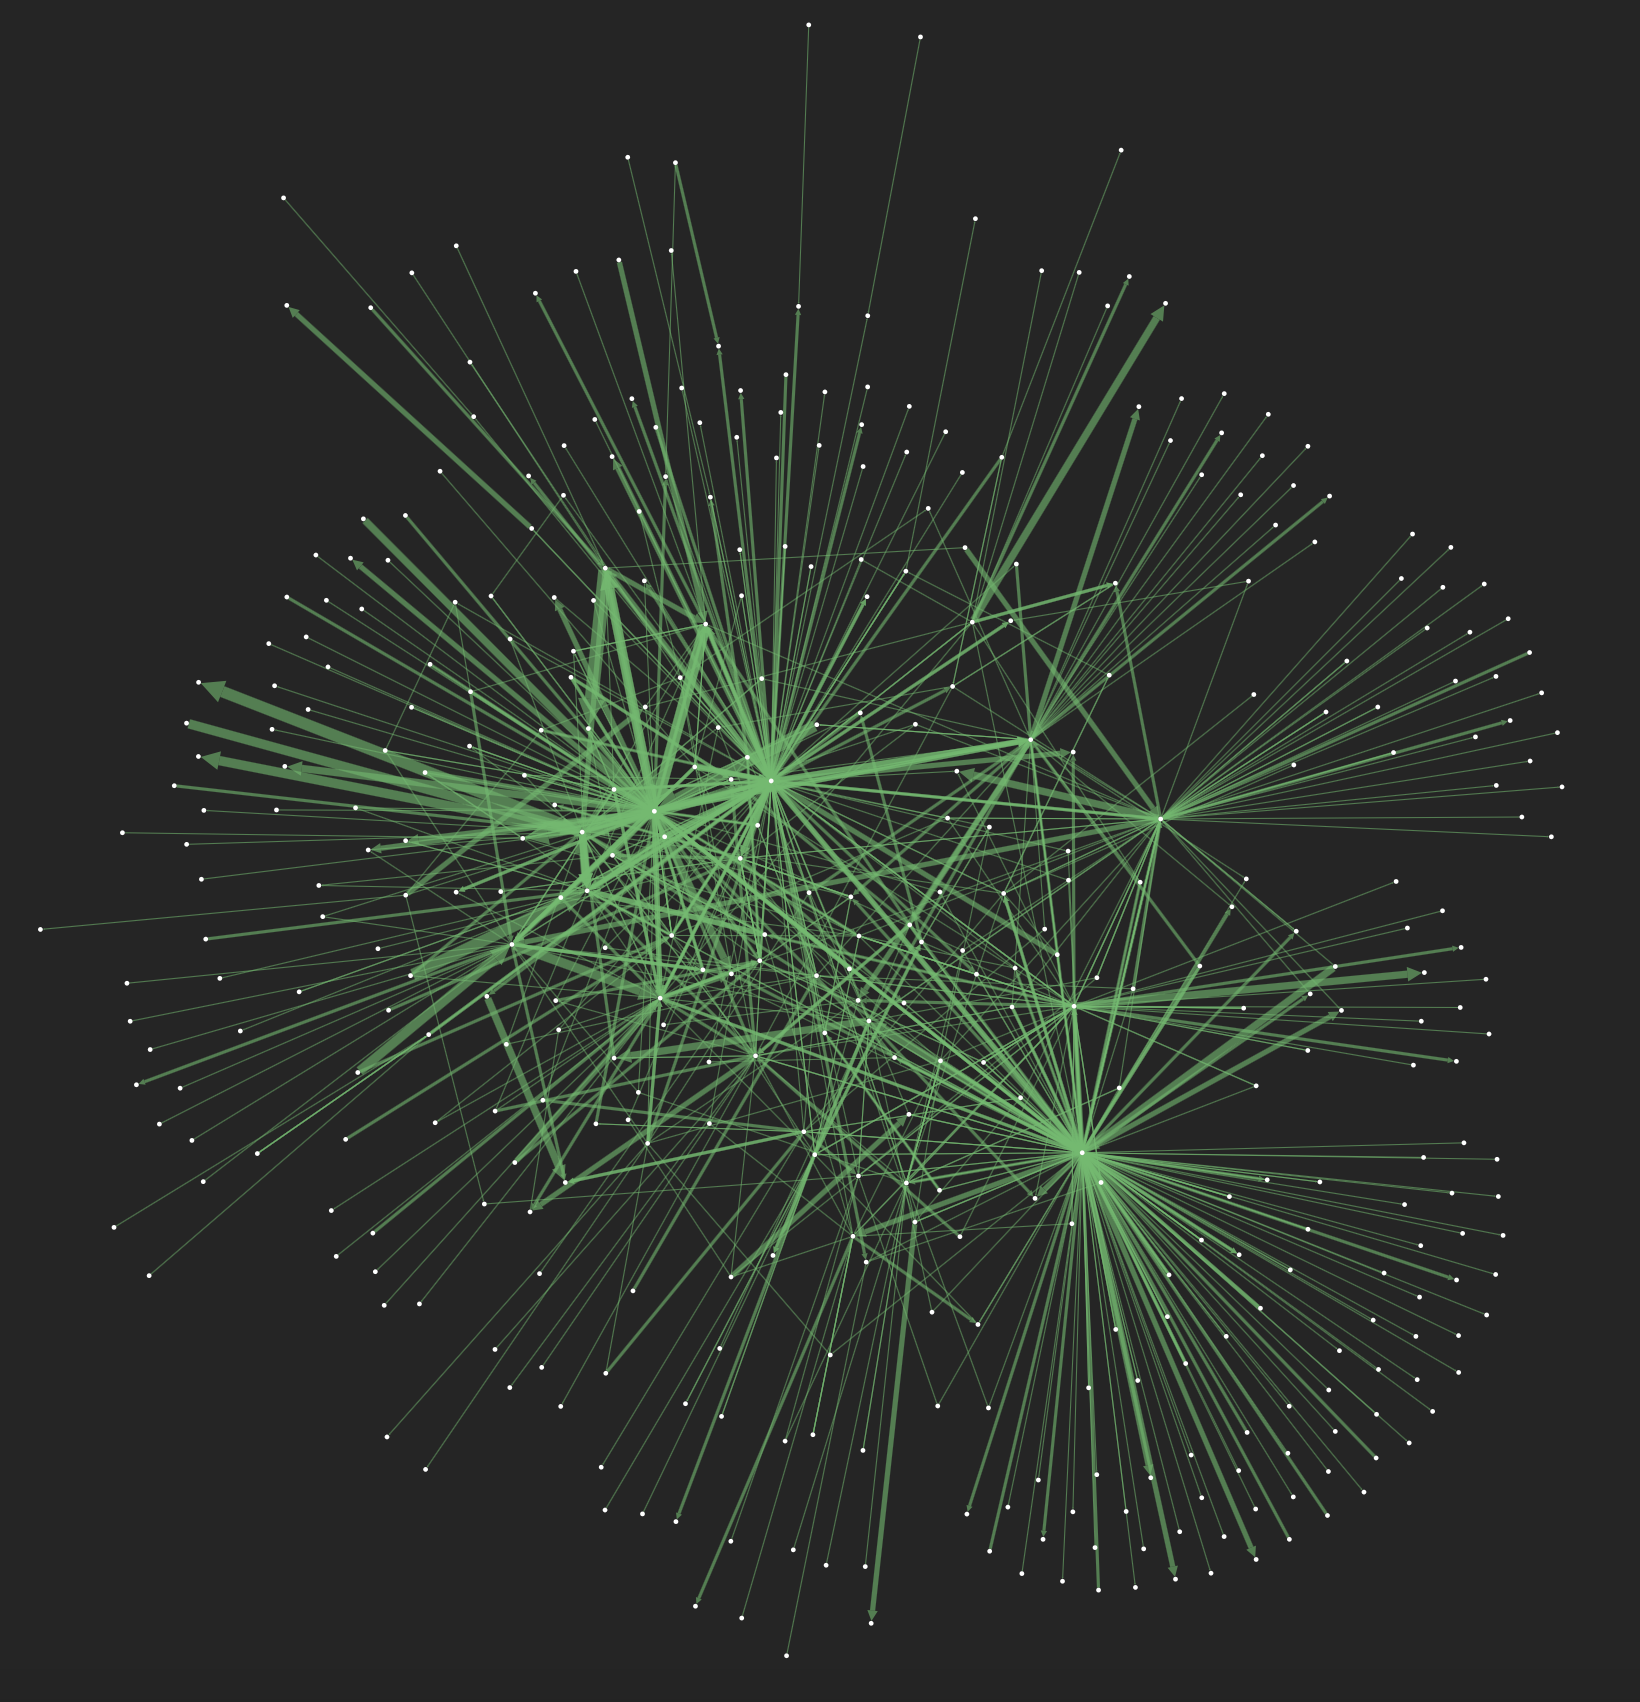
System Support Structure on Goal Striving Entities
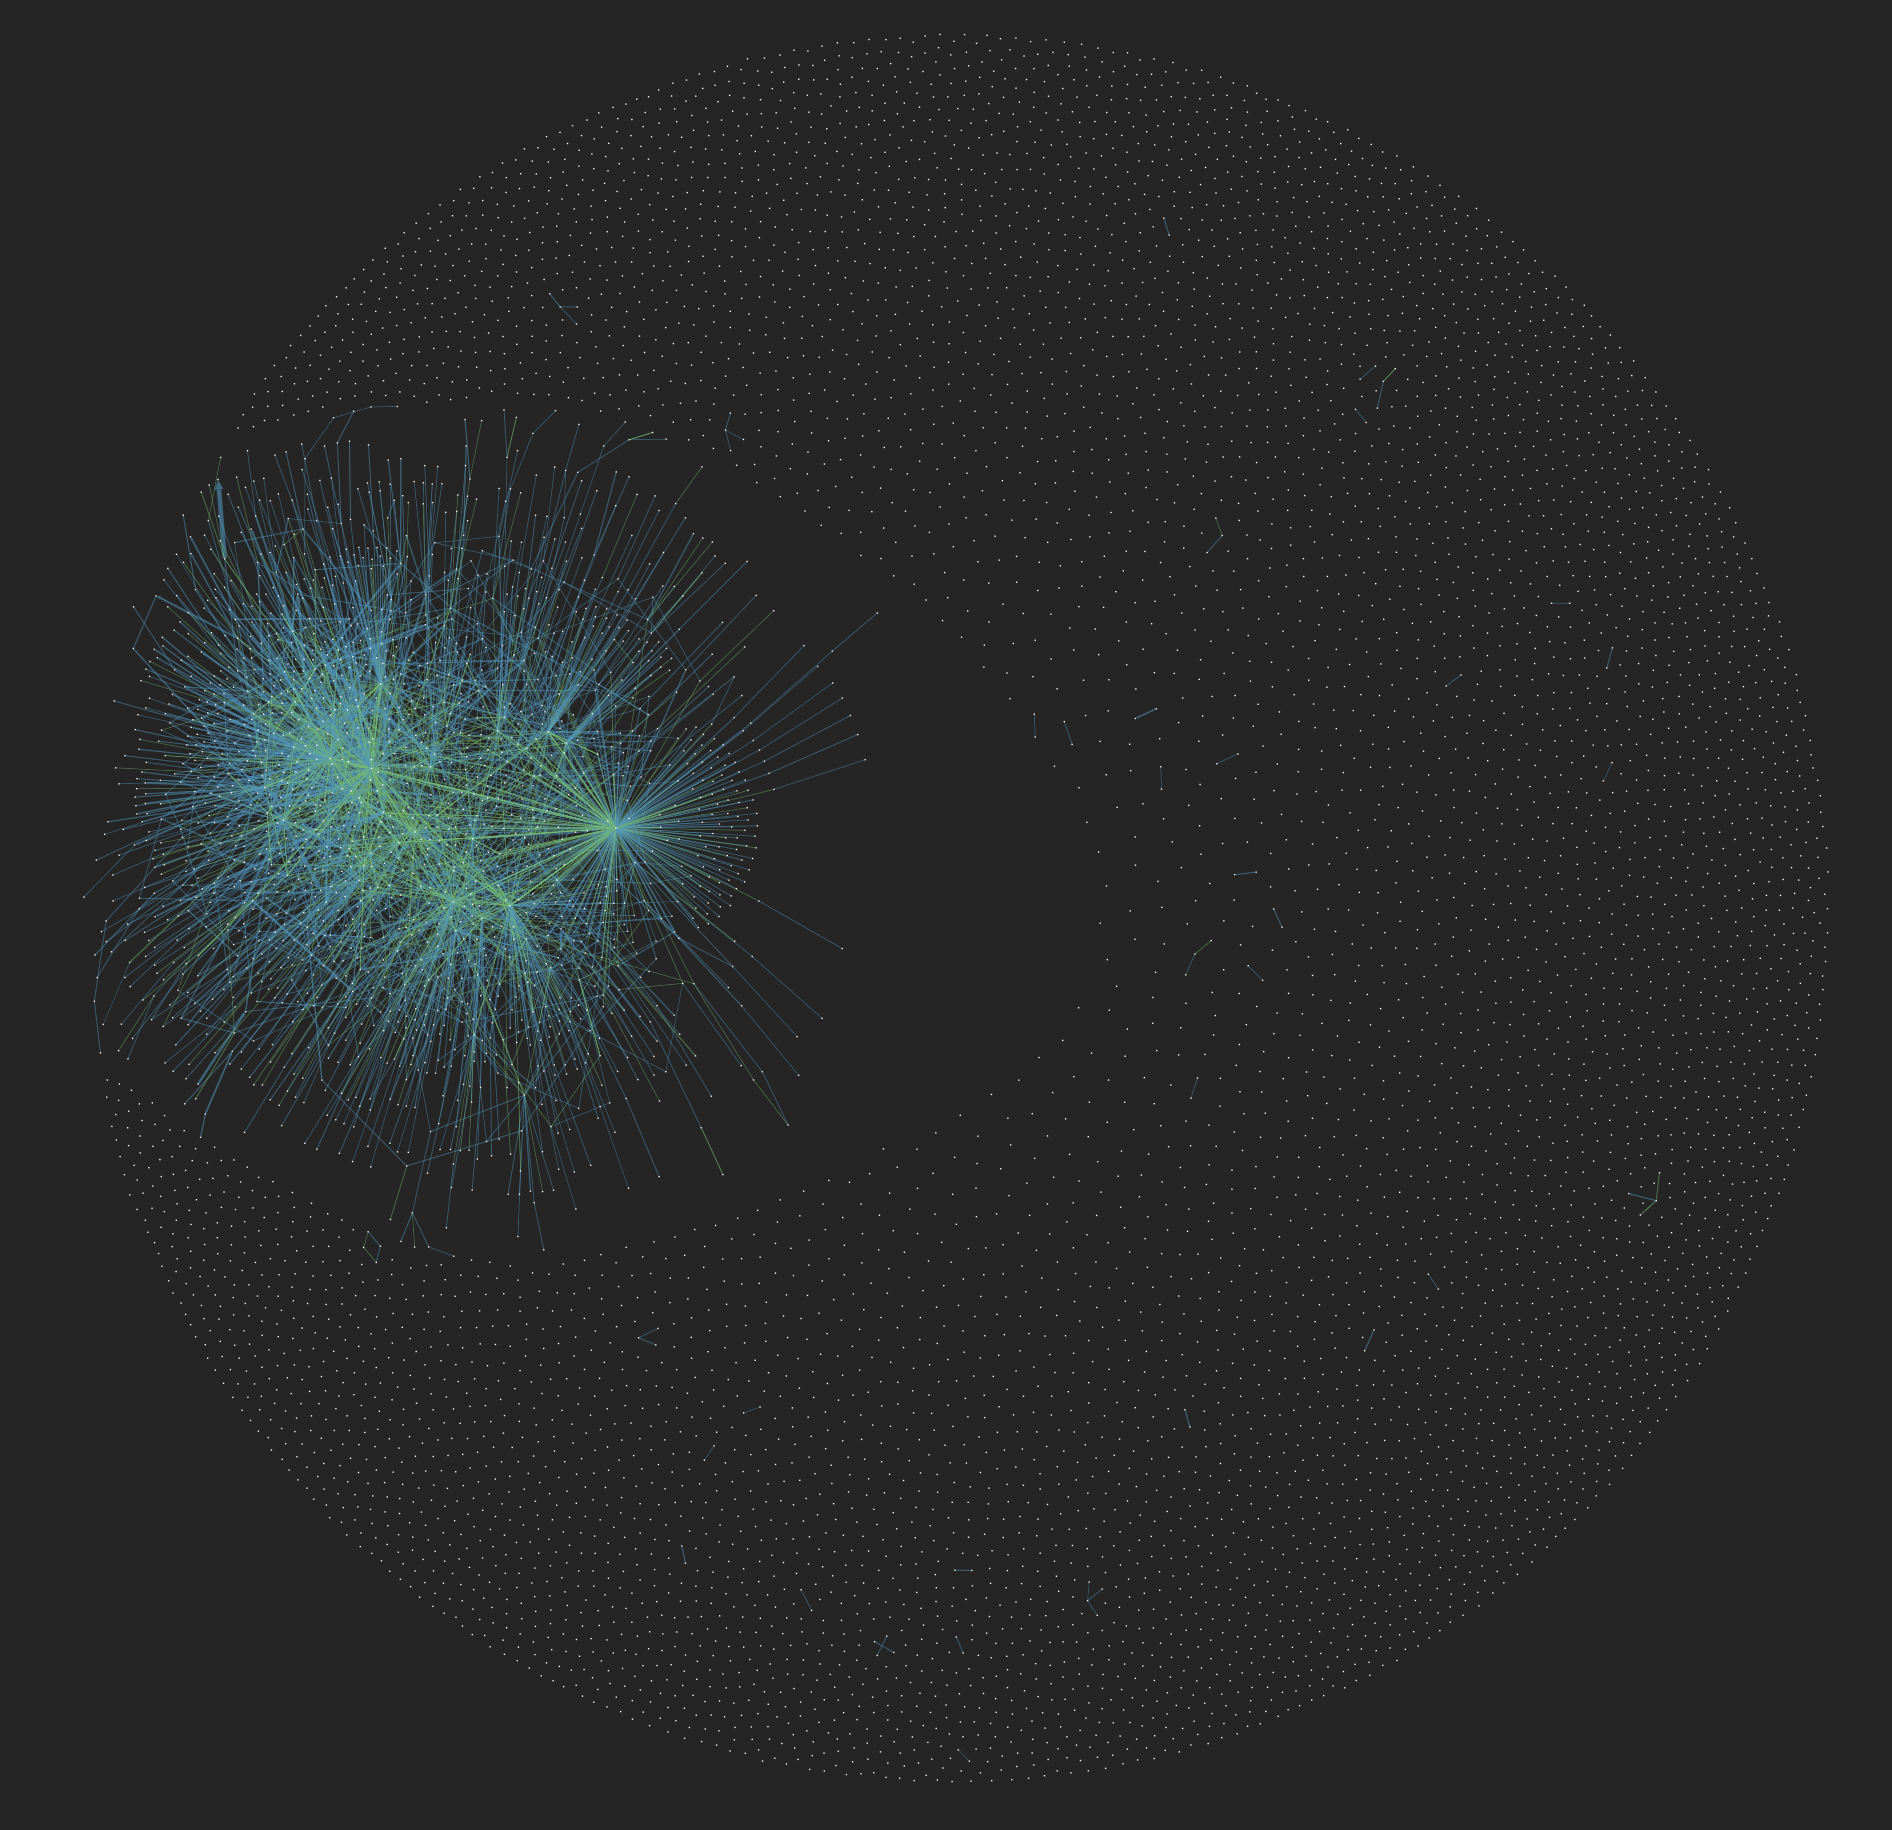
Network Motivation (combined G and S links)
Copyright James D. Westaby (C). All rights reserved.
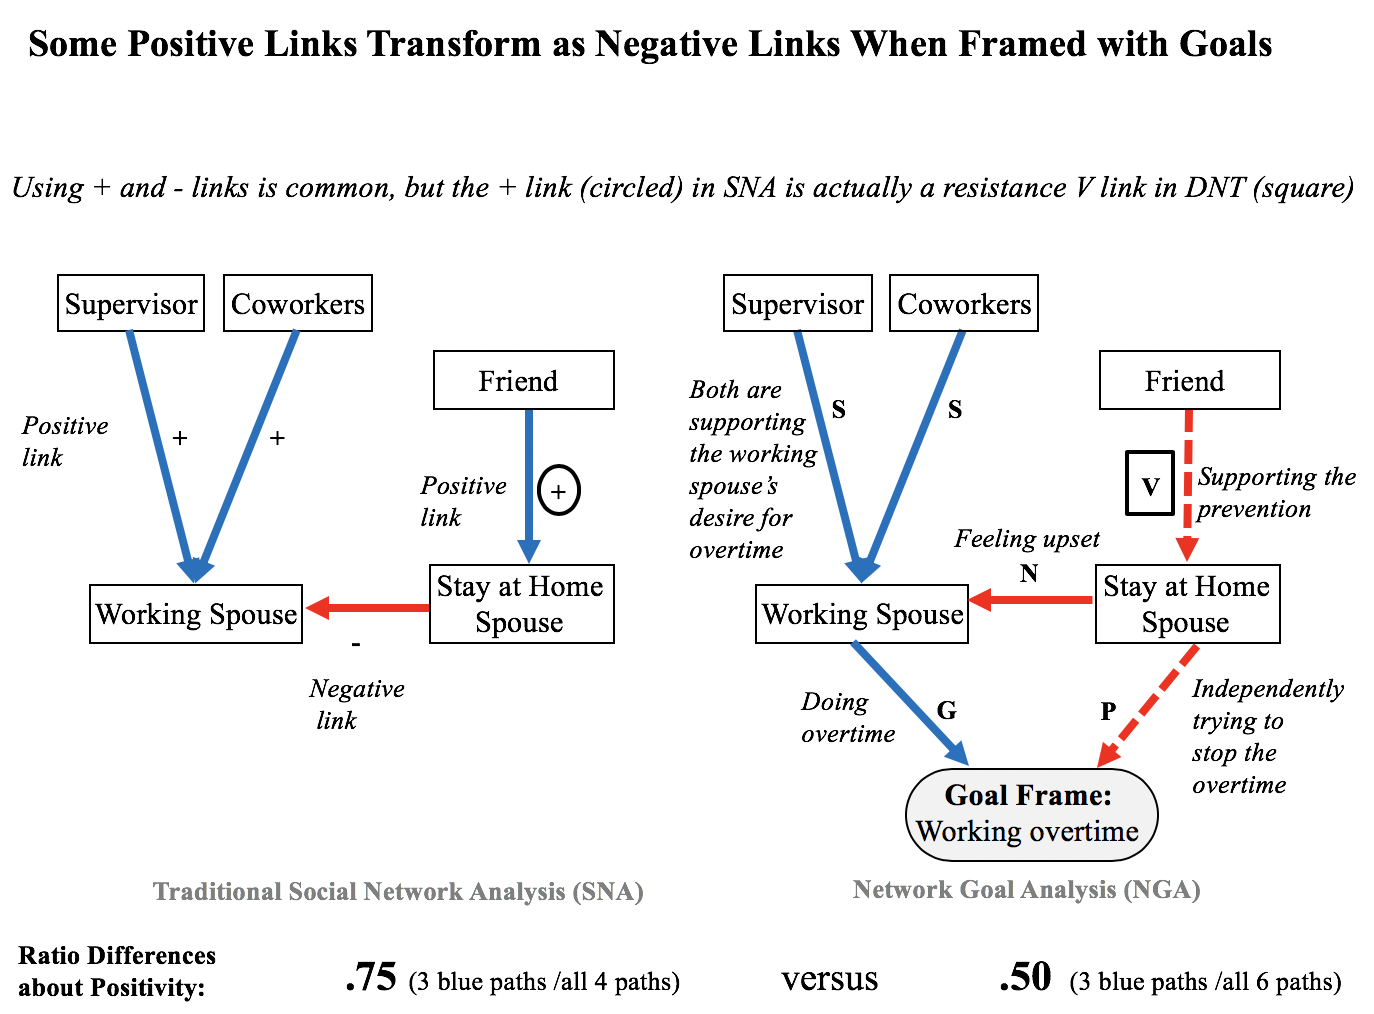
Comparing Approaches
The following illustrates some basic differences between organizational charts (no goals), traditional social network analysis (no goals), and network goal analysis (with goals), which we also referred to as dynamic network charts in the past. The new terminology may help create better differentiation from traditional approaches.

-->see Westaby et al. (2014)
However, it is important to keep in mind that network goal analysis supplements traditional social network analysis, it is not meant to replace it. There are many investigations that can rightfully focus on structural relations alone with considerable importance, such as examining information flow and friendship networks. Network goal analysis becomes of interest if those analyses are also interested in examining the multiple goals being targeted in those systems or why those linkages may be occurring.
Computerized Contrasts
The following illustrations use our computer visualizations, which are automatically generated from our network goal surveys. The R statistical program is used heavily in our analytic and visualization work. This example illustrates the modeling of a simple supervisory example.
--Traditional Social Network Analysis (no goal node)
- System support linkages shown (S)
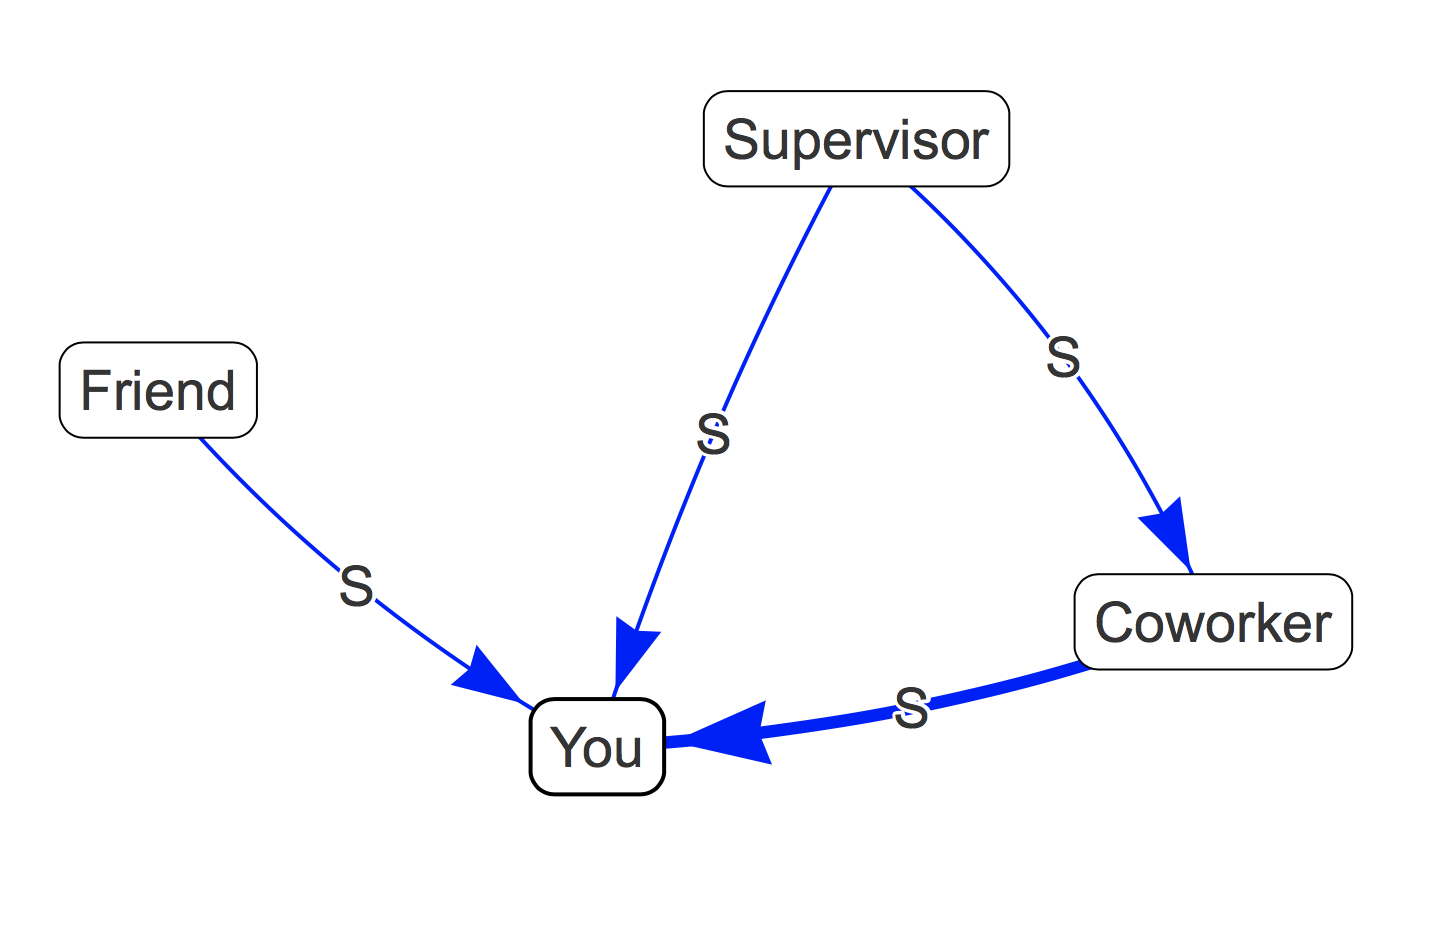
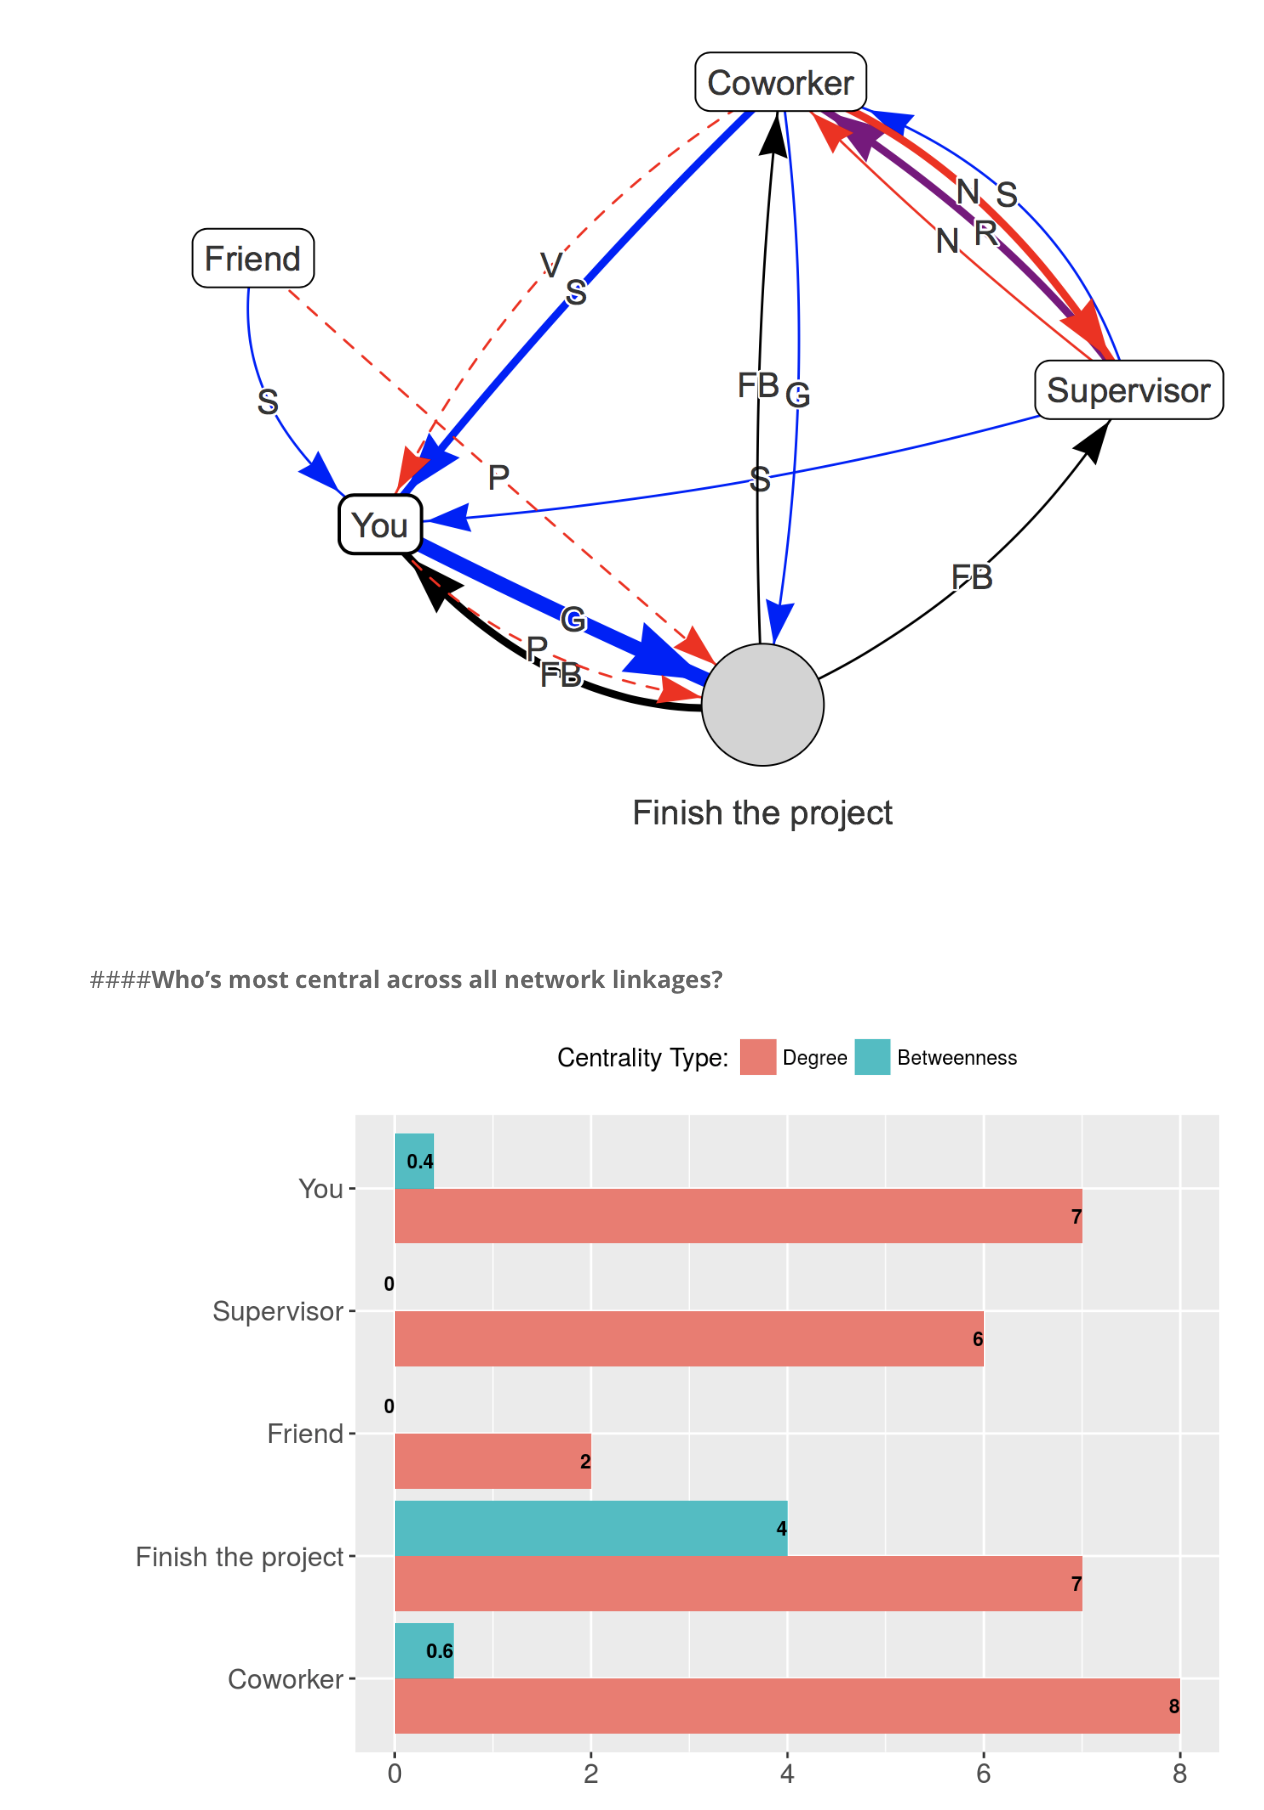
--Network Goal Analysis (goal node inserted)
- "Network motivation" sub-network shown with goal striving (G), feedback (FB), and system support (S), which we have also referred to as "goal pursuit links".
Why Network Goal Analysis Can Add Critical Value Above
In the above visual, you can see that the focal entity, "You", is independently working on the goal very intensely with the Coworker providing some independent work, but not as strongly. Moreover, you can see that the Supervisor is not working directly on the project, but instead serving a more inter-dependent support function. Network goal analysis allows us to see all the underlying dynamics, including who gets feedback from the goal pursuit itself (e.g., information from task instruments), a critical motivational factor in psychological science.
Other Major Differences
-->see Westaby & Shon (2017)
Network goal analyese can also easily examine team dynamics. Click here to see how team social networks can be examined around their goals and objectives.
Copyright James D. Westaby (C). All rights reserved.
The manual approach can be helpful to quickly describe a situation of interest and has been used many times in education, practice, and intervention. Little technology is needed and it can be drawn by hand as well, which is especially helpful to describe basic dynamics of human interaction. One simply needs to have basic knowledge about the theory, its social network roles, and the simple graphing techniques, such as illustrated in the Appendix of Westaby (2012) or some of the basic ideas demonstrated on this website. If referring to this original theory book, please keep in mind that we are now generalizing system reactance to represent constructive linkages during conflicts.
To note, though, the manual approach can be laborious since all summary calculations need to be done manually and it's harder to fit a full analysis in one page by hand when the system gets larger. It's also harder when trying to examine different motivational parts of our systems, such as contrasting system support to goal prevention sub-networks. For centrality metrics, computer automation is helpful and almost always a necessity as well, since it can be difficult for non-statisticians to generate such metrics in larger systems. Our network goal surveys and network goal graphs are generated automatically by computer, simplifying the process immensely in research projects.
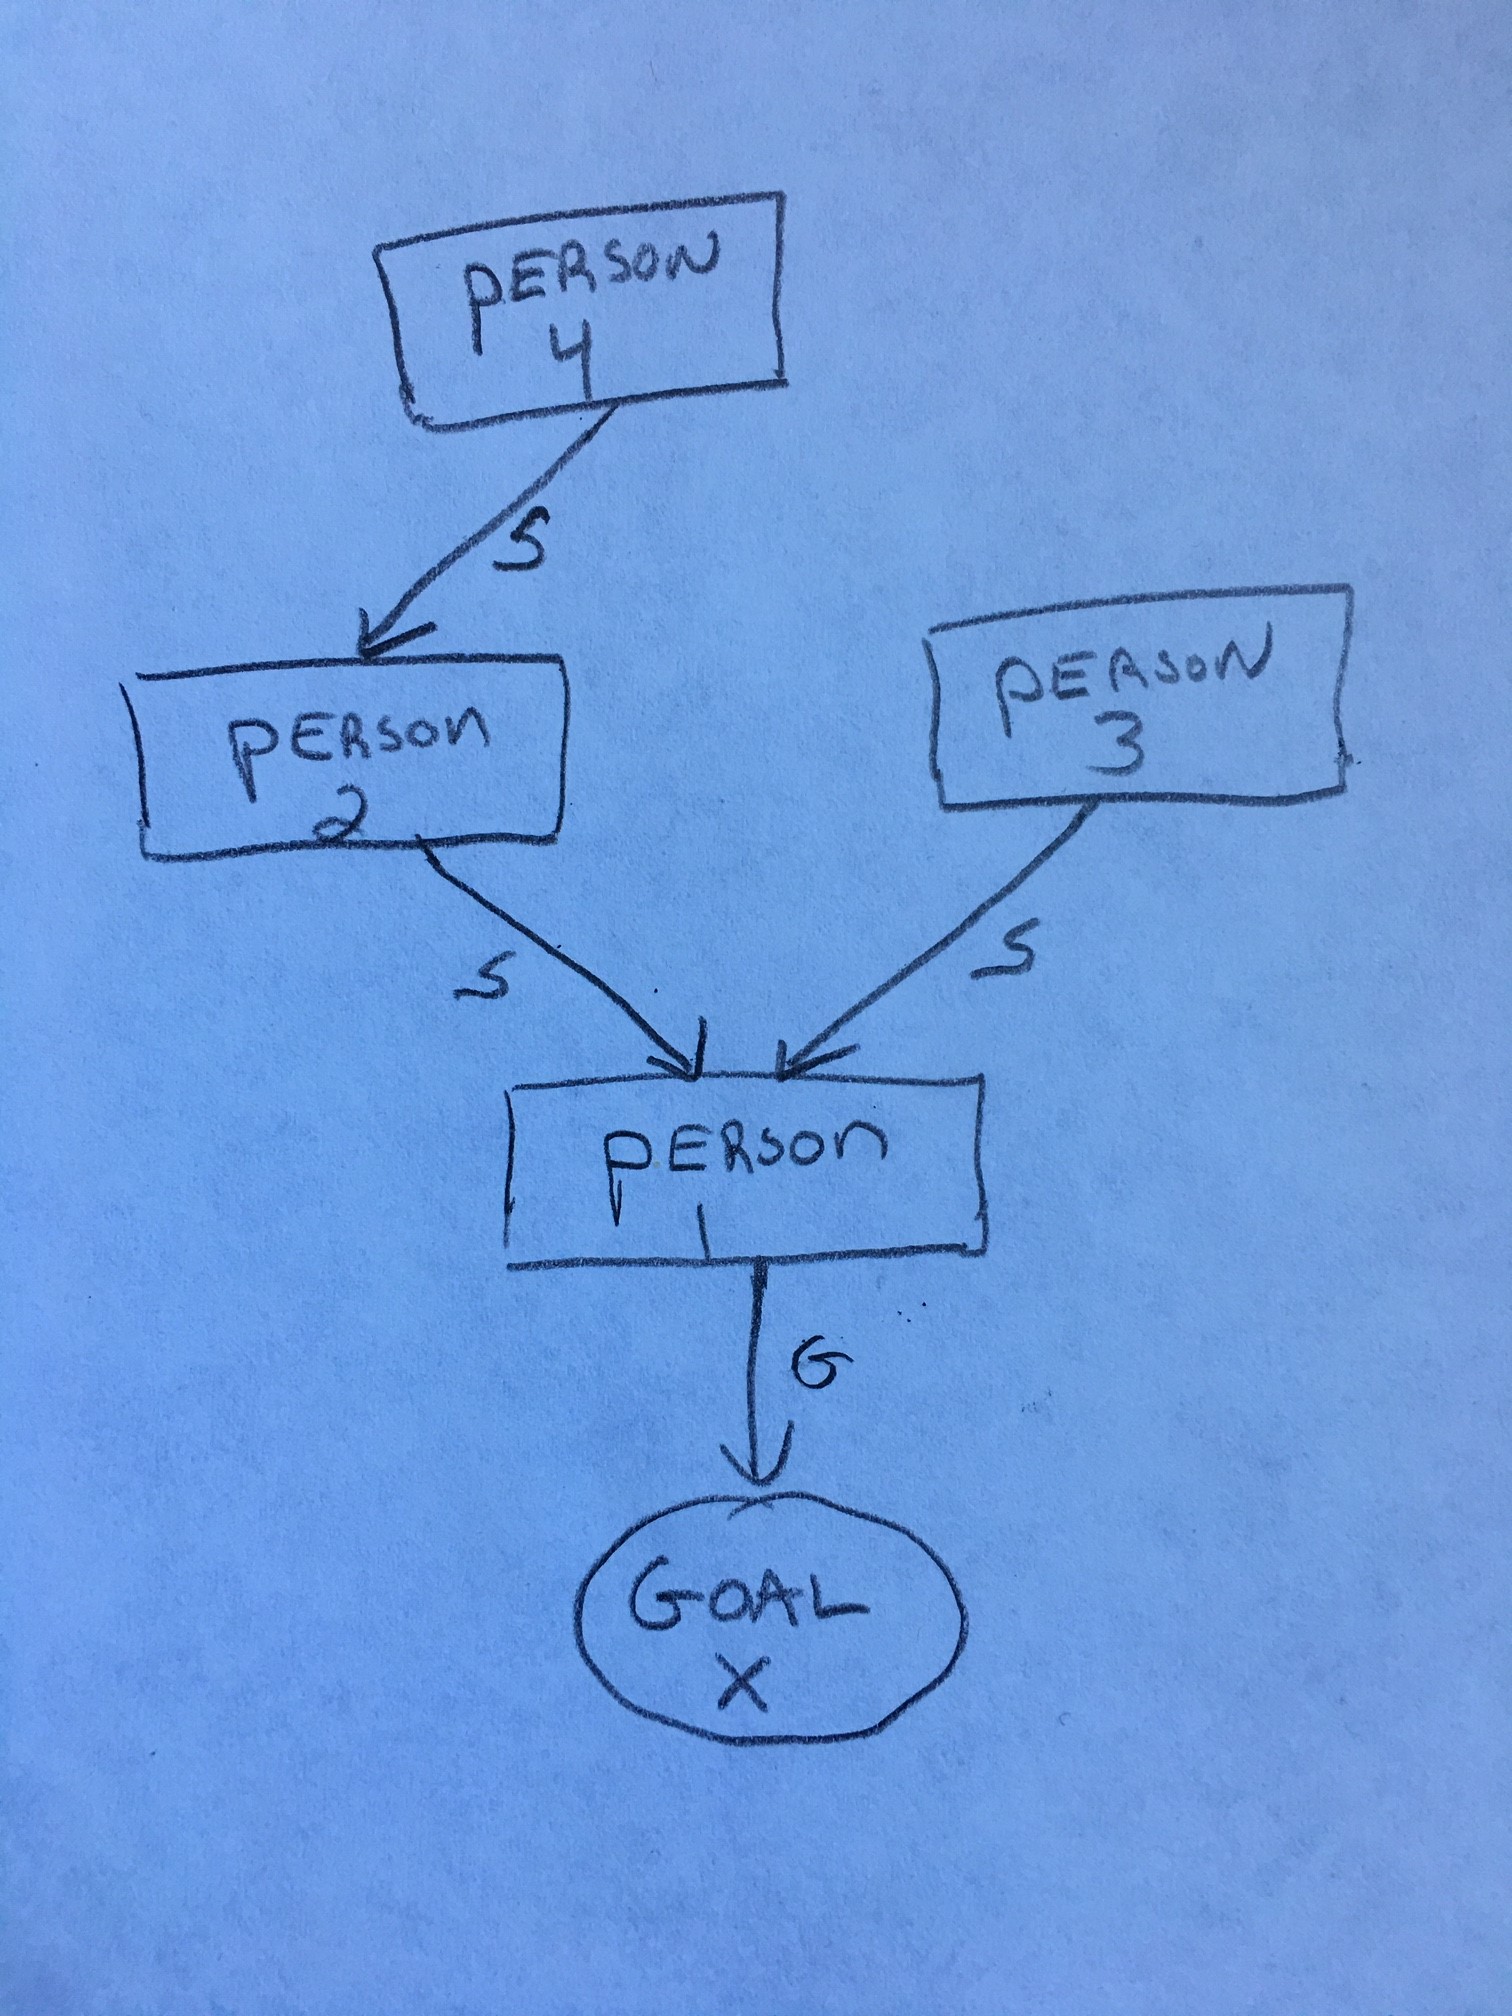
Nonetheless, a simple system is drawn by hand of Person 1 striving for Goal X. This person has two direct supporters (Person 2 and Person 3) and one of those supporters (Person 2) is also getting help from another distal supporter (Person 4), who is also indirectly helping in the system. Hence, this qualitative narrative can be visualized in quantitative chart form below. In other words, the story can be transposed into graph form by hand or by our survey tools, thus making it quantitative (i.e., the simple links shown below could be scored 1 and non-links/structural holes could be scored 0 between given dyads).
Example Manually Drawn by Hand

Steps to Create Manual Network Goal Graphs (aka Dynamic Network Charts)
See Appendix in Westaby (2012) for more detailed illustrations, but keep in mind, again, that we have now re-formulated system negation (N) to more broadly represent entities being "upset" with one another in relation to the focal goal and system reactance (R) to represent constructive reactance to such conflicts.
Computerized Tools
Using R statistical programming, researchers using our tools/method can take survey results and automatically transform them into striking network goal analysis (also previously known as dynamic network charts) - visualizations of the dynamic network. This allows researchers to more deeply understand system dynamics as well as start planning positive change in applied studies.
The computerized reports allow participants to visually zoom in on key relations impacting their pursuits or lives, ranging from supportive and loving ones to those generating conflict and despair. These visualizations allow researchers to bridge the gap between complexity and parsimony, something that social, organizational, and international scholars have struggled with in the past.
We believe that parsimonious explanations, grounded in dynamic network theory, underlie many of the complexities we see in everyday life at individual, group, organizational and even international levels. Practically, our computer visualizations give survey participants or research partners unique insight into improving goal achievement, performance, climates, and system well-being. Researchers can click here to see the methods and statistical tools used in the Lab.